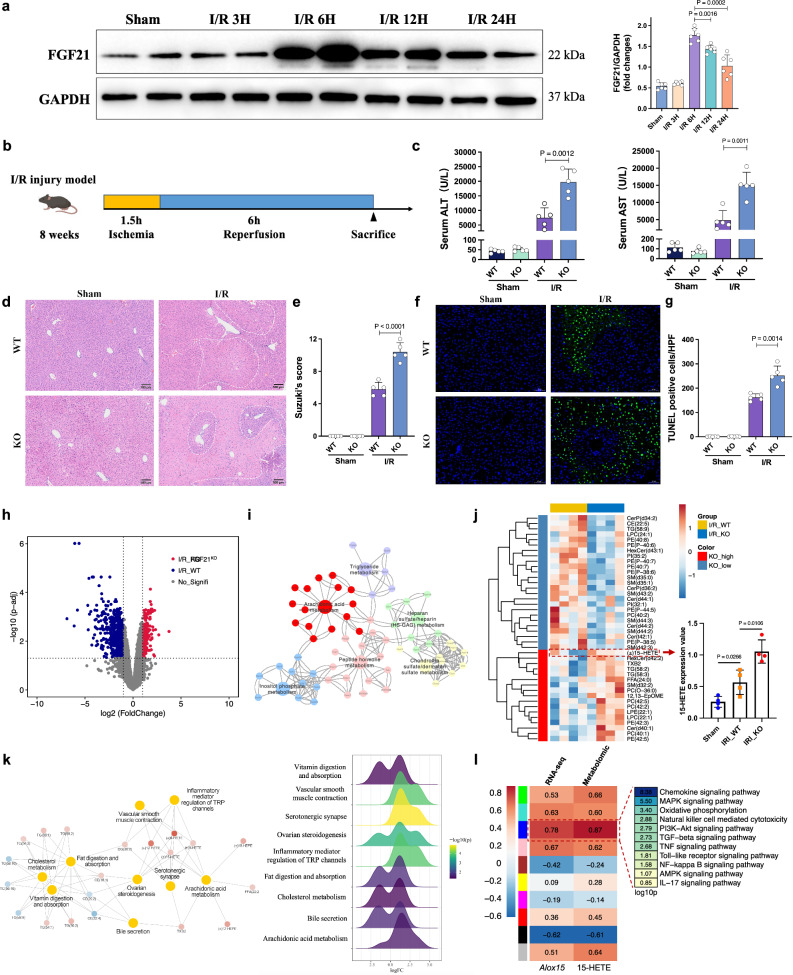
Fig. 2. FGF21 deficiency aggravated I/R-induced liver injury.
a The time-dependent western blot analysis (left) and quantification (right) of FGF21 protein expression in the mouse liver undergoing ischemia for 1.5 h followed by the indicated duration of reperfusion, three independent biological mice samples. b Schematic for the establishment of the mouse I/R injury model. c Serum ALT and AST levels of wild-type and Fgf21 KO mice in the sham and I/R groups 6 h after reperfusion (n = 5, per group). d Representative H&E staining of liver sections from wild-type and Fgf21 KO mice in the sham and I/R groups. e Liver damage was evaluated using Suzuki’s histological score (n = 5, per group). f Representative TUNEL immunofluorescent staining in liver lobes of wild-type and Fgf21 KO mice in the sham and I/R groups. g Quantification analysis of the TUNEL-positive cells/high-power field (n = 5, per group). h Volcano plot of the differentially expressed genes (DEGs) between wild-type and Fgf21 KO livers after I/R treatment (n = 4) using the absolute value of log2 (fold change) >1.5 and p < 0.05 as the thresholds. i KEGG pathway enrichment analysis of the identified DEGs. j Heatmap of major metabolites catalyzed by lipoxygenases in wild-type and Fgf21 KO livers after I/R treatment (n = 4). The 15-HETE content was elevated in Fgf21 KO livers. k Co-expression network and KEGG pathway analysis of the hub metabolites. l The Pearson correlation coefficients between ALOX15/15-HETE (RNA-seq/metabolomic) and the co-expression modules identified by WGCNA. KEGG analysis of the module with the highest correlation coefficients (p < 0.05 by Fisher’s exact test, two-sided). WT, wild-type, KO knockout, I/R ischemia/reperfusion, ALT alanine aminotransferase, AST aspartate aminotransferase. a, c, e, g, j Two-tailed t test. Statistic data are presented as the mean ± SD, error bars represent the means of at least three independent experiments. p values are shown on the graphs, p < 0.05 was considered statistically significant. Source data are provided as a Source Data file. Figure 2b created with BioRender. com released under a Creative Commons Attribution-NonCommercial-NoDerivs 4.0 International license (https://creativecommons.org/licenses/by-nc-nd/4.0/deed.en).

