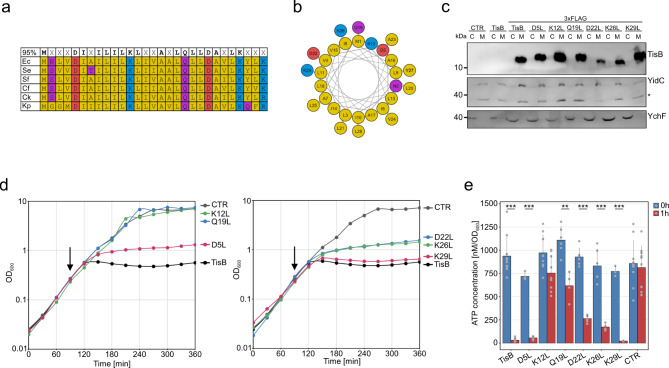
Fig. 1.
Importance of single amino acids for TisB functionality. (a) Conservation analysis of TisB. Conservation levels of TisB were determined via BLAST. Amino acids with 95% conservation are in bold. E. coli K-12 (Ec), Salmonella enterica serovar Typhimurium (Se), Shigella flexneri (Sf), Citrobacter freundii (Cf), Citrobacter koseri (Ck), and Klebsiella pneumoniae (Kp). Amino acids color code: nonpolar (yellow), polar (purple), acidic (red), and basic (blue). (b) Helical wheel projection of TisB. Same color code as in (a). (c) Western blot analysis of TisB localization. Wild type MG1655, harboring p0SD-3xFLAG-tisB (3xFLAG-TisB) and variants with different amino acid substitutions, were treated with L-ara (0.2%) during exponential phase for one hour. p0SD-tisB (TisB) and an empty pBAD plasmid (CTR) were used as controls. Cytoplasmic (C) and membrane (M) fractions were isolated from total protein samples using ultracentrifugation, followed by Tricine-SDS-PAGE and western blot detection. An anti-3xFLAG antibody was used for detection of 3xFLAG-TisB. Anti-YidC (membrane) and anti-YchF (cytoplasm) antibodies were used as fractionation controls. For unedited western blot images, see Supplementary Fig. S2. (d) Growth inhibition by TisB. Wild type MG1655, harboring p0SD-tisB (TisB) and variants with different amino acid substitutions, were treated with L-ara (0.2%) during exponential phase (arrow). An empty pBAD plasmid (CTR) was used as control. Data points of OD600 measurements represent the mean of at least three biological replicates (TisB: n = 9; CTR: n = 9; D5L: n = 3; K12L: n = 3; Q19L: n = 3; D22L: n = 6; K26L: n = 3; K29L: n = 3). (e) TisB-dependent ATP depletion. Wild type MG1655, harboring p0SD-tisB (TisB) and variants with different amino acid substitutions, were treated with L-ara (0.2%) during exponential phase for one hour. An empty pBAD plasmid (CTR) was used as control. Pre- and post-treatment samples were analyzed using a luciferase-based assay to measure cellular ATP levels (nM per OD600). Bars represent the mean of at least three biological replicates (TisB: n = 7; CTR: n = 9; D5L: n = 4; K12L: n = 9; Q19L: n = 4; D22L: n = 6; K26L: n = 4; K29L: n = 3). Error bars indicate the standard deviation. ANOVA with post-hoc Tukey HSD test was performed (*** p < 0.001; ** p < 0.01).

