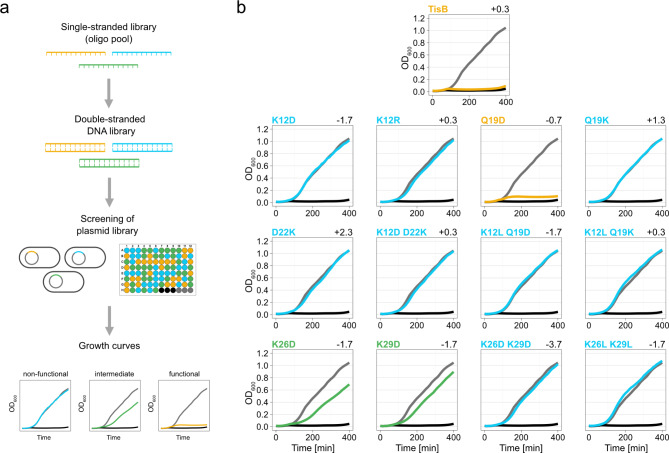
Fig. 5.
Screening of a tisB expression library. (a) Schematic representation of generation and screening of the tisB expression library. A single-stranded DNA library, representing various tisB variants, was converted into a double-stranded DNA library via PCR and cloned into expression plasmids. Plasmids were transformed into wild type MG1655 and screened with respect to growth inhibition in the presence of L-ara (0.2%) in a 96-well format. TisB variants were categorized as non-functional (blue), intermediate (green), and functional (yellow). (b) Screening of the tisB expression library. After growth analysis, results for each TisB variant were combined to generate mean growth curves (native TisB: n = 7; K12D: n = 2; K12R: n = 5; Q19D: n = 6; Q19K: n = 7; D22K: n = 4; K12D D22K: n = 2; K12L Q19D: n = 7; K12L Q19K: n = 5; K26D: n = 4; K29D: n = 3; K26D K29D: n = 4; K26L K29L: n = 2). Three biological replicates of p0SD-tisB (black) and an empty pBAD plasmid (grey) were included as controls. The individual net charge of each TisB variant (as calculated with the Prot pi Protein Tool) is represented on the top right of each plot.

