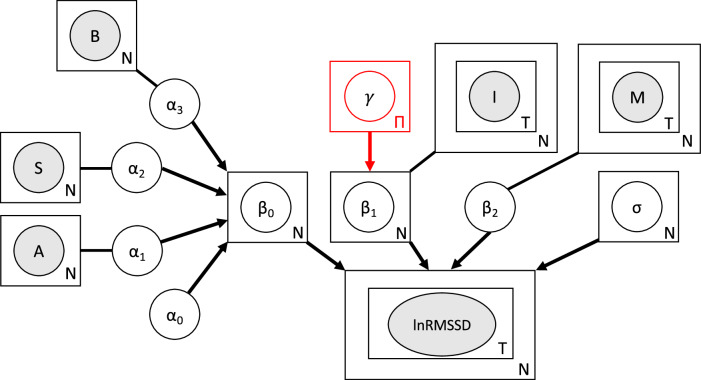
Fig. 2. lnRMSSD data generating process assumed in the regression models.
Grey-shaded nodes represent observed variables, while white nodes represent the model’s parameters. Arrows define conditional dependencies in the model graph, while lines connecting parameters to their covariates do not define any probabilistic dependency but are shown simply to clarify which covariate a parameter refers to. The plate notation is used for observed variables and parameters that are repeated, where the letter indicates the number of repetitions; in other words, it indicates the nested structure in the data and in the model. For example, lnRMSSD is contained in two plates: the outer one indicating that samples are drawn at the subjects' level where N is the total number of subjects, the inner one indicating that within each of the N individuals, samples are taken at T times. The node for γ and its outgoing arrow are in red to mark that this node, and thus the dependency of its descendants on episode’s polarity where there are Π = 2 polarities (mania and depression), is only present in the two-polarities-model into which the one-disease-model, differing only by the lack of this node, is nested. A: age; S: sex; B: baseline symptoms' severity; I: symptoms' improvement; M: medications.

