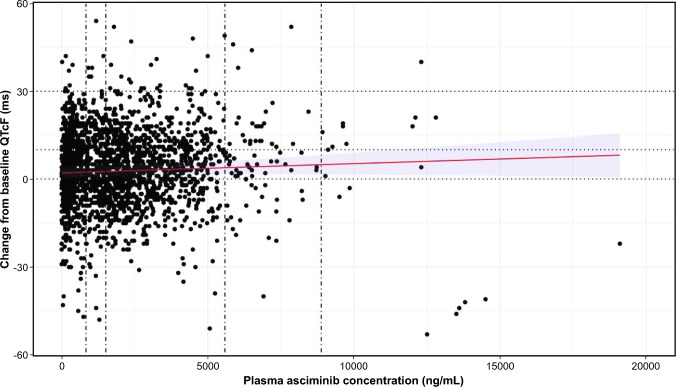
Fig. 4.
Scatterplot, regression line (red), and 90% CI (blue shaded area) of change from baseline QTcF versus plasma asciminib concentration. Data are from 239 patients from the dose-finding study (patients with CML and Ph+ acute lymphoblastic leukemia). Each circle represents a data point (PK sample with time-matched QTc assessment) any time post-asciminib dose. Vertical lines represent median Cmax for 40 mg b.i.d., 80 mg q.d., 200 mg b.i.d. and HCRE. Scatterplot includes only the matched ECG records. The model was QTcF change from baseline = concentration + baseline QTcF are fixed effects, and patient is a random effect. b.i.d. twice daily, CI confidence interval, Cmax maximum plasma concentration, HCRE highest clinically relevant exposure, PK pharmacokinetic, q.d. once daily, QTcF QT interval corrected using the Fridericia method, TKI tyrosine kinase inhibitor

