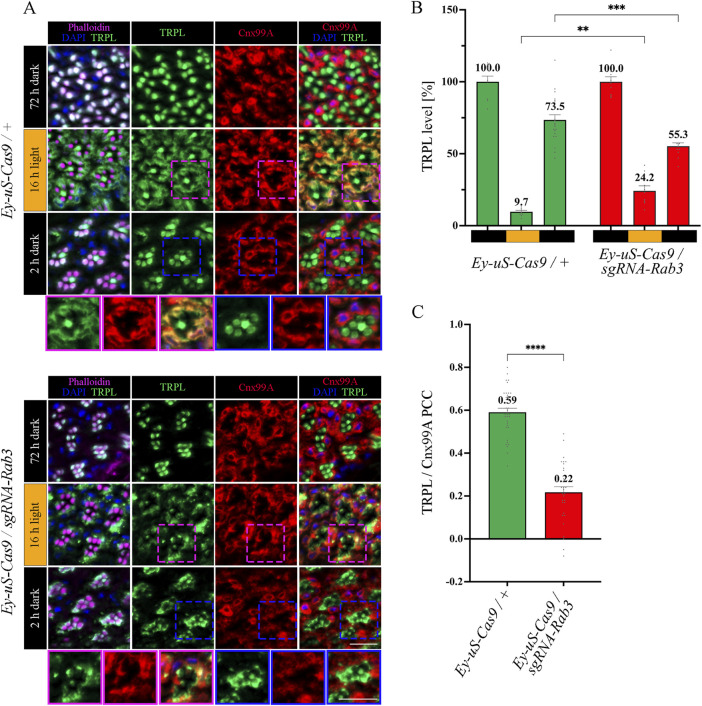
FIGURE 3.
Rab3 gene disruption hinders TRPL transport to the ER. (A) Localization of TRPL in Ey-uS-Cas9/+ control flies and Rab3 CRISPR mutants in d, d-l, and d-l-d conditions. Flies were dark-adapted for 72 h (d), then exposed to orange light for 16 h (d-l), and were subsequently returned to darkness for another 2 h (d-l-d). Cross sections through ommatidia were probed with α-TRPL antibodies and α-Cnx99A antibodies, as indicated. Rhabdomeres were visualized using phalloidin and nuclei were stained with DAPI. Images at the bottom of each panel show a magnification of the indicated areas above. Scale bar: 10 μm. (B) Quantification of fluorescence signals of TRPL in the rhabdomeres. Signals in R1-R6 rhabdomeres were normalized to the signal of R7 rhabdomeres and the mean of values obtained after the initial dark adaptation was set to 100%. Statistically significant differences analyzed by a two-way ANOVA calculation with Bonferroni correction are indicated (** p < 0.01, *** p < 0.001). Error bars: SEM (n = 3–7). (C) Colocalization of TRPL with the ER marker Cnx99A after 16 h of orange light illumination. Colocalization was assessed using Pearson correlation. The TRPL channel was chosen for the selection of the areas to be quantified. Statistically significant differences analyzed by an unpaired t-test (**** p < 0.0001) Error bars: SEM (n = 5–6).

