FIGURE 5.
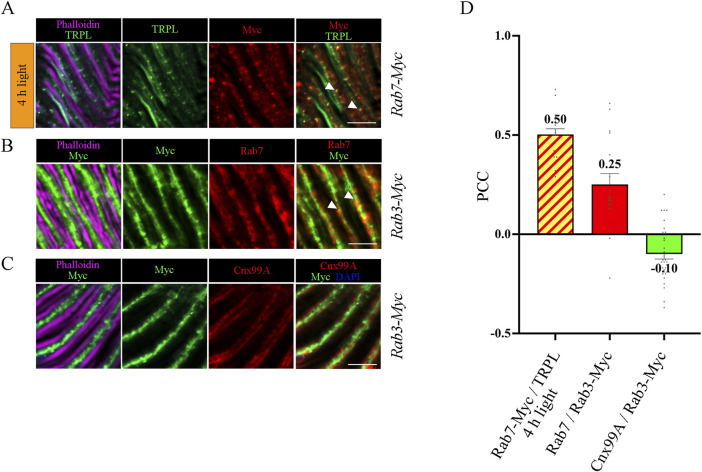
Colocalization analysis of TRPL, Rab3 and Rab7. (A) Colocalization of TRPL and Rab7-Myc positive vesicles in longitudinal sections of Rab7-Myc ommatidia. Flies were initially kept in the dark for 1 day and were then exposed to orange light for 4 h. TRPL was labeled with an α-TRPL antibody, Rab7-Myc was labeled with an α-Myc antibody. Rhabdomeres were visualized with phalloidin. Arrowheads indicate colocalization of TRPL with Rab7-Myc at time point 4 h of orange light illumination. Scale bar: 10 μm. (B) Colocalization of Rab7 and Rab3-Myc in longitudinal cryosections of Rab3-Myc ommatidia. Rab7 was labeled with an α-Rab7 antibody, Rab3-Myc was labeled with an α-Myc antibody. Rhabdomeres were visualized using phalloidin. Arrowheads indicate colocalization of Rab7 with Rab3-Myc. (C) Colocalization of Rab3-Myc and Calnexin in longitudinal cryosections of Rab3-Myc ommatidia. Calnexin was labeled with an α-Cnx99A antibody, Rab3-Myc was labeled with an α-Myc antibody. Rhabdomeres were visualized using phalloidin and nuclei using DAPI. Scale bar: 10 μm (D) Quantification of colocalization of TRPL with Rab7-Myc after 4 h of orange light illumination. The TRPL channel was chosen for the selection of the areas to be quantified. Quantification of colocalization of Rab7 with Rab3-Myc, and Cnx99A with Rab3-Myc. The Rab3-Myc channel was chosen for the selection of the areas to be quantified. Colocalization was assessed using Pearson correlation. Error bars: SEM (n = 3–5).

