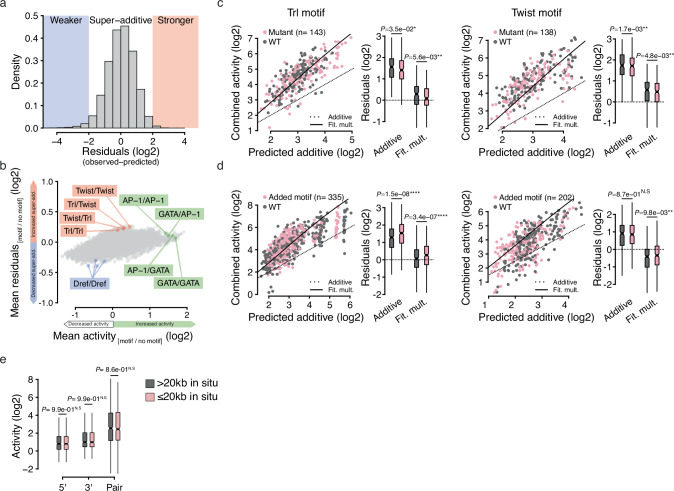
Fig. 3. Developmental enhancer super-additivity is promiscuous.
a Distribution of the residuals of the fitted multiplicative model with interaction term, ranging from negative (weaker super-additivity, in blue) to positive (stronger super-additivity, in orange). b For each pairwise combination of TF motifs (120 × 120 = 14,400), the mean impact on the activity (x-axis) and on the residuals (y-axis) of corresponding enhancer pairs are shown. For example, Trl/Twist pairs (in which the 5’ and 3’ enhancers contain at least one instance of the Trl and Twist motifs, respectively) show globally increased residuals (in orange). AP-1 and GATA motifs strongly affected enhancer activity, while the Dref motif negatively impacted activity and super-additivity. c, d Impact of mutating (c, in pink) or adding (d, in pink) Trl (left) or Twist motifs (right) on the predicted additive (x-axis) versus observed combined activities (y-axis) of developmental enhancer pairs. As a reference, corresponding wild-type (WT) developmental enhancer pairs are shown in gray. Dotted lines depict the identity line (where observed combined activities equal expected additive outcomes), and solid lines represent the fitted multiplicative model. For each condition, the residuals of WT versus mutant pairs were quantified (see box plots on the right) using either the additive or the fitted multiplicative model (Fit. mult, see x-axis) and compared using paired, two-sided Wilcoxon tests. Box plots show the median (line), upper and lower quartiles (box) ±1.5× interquartile range (whiskers), outliers are not shown. e Quantitative comparison of the activity of enhancer pairs from the same locus (≤20 kb distance in situ, in pink) versus an activity-matched set of distant enhancer pairs (>20 kb, in gray). n = 567 pairs per box plot. Two-sided Wilcoxon test P-values are shown; box plots show the median (line), upper and lower quartiles (box) ±1.5× interquartile range (whiskers), outliers are not shown.

