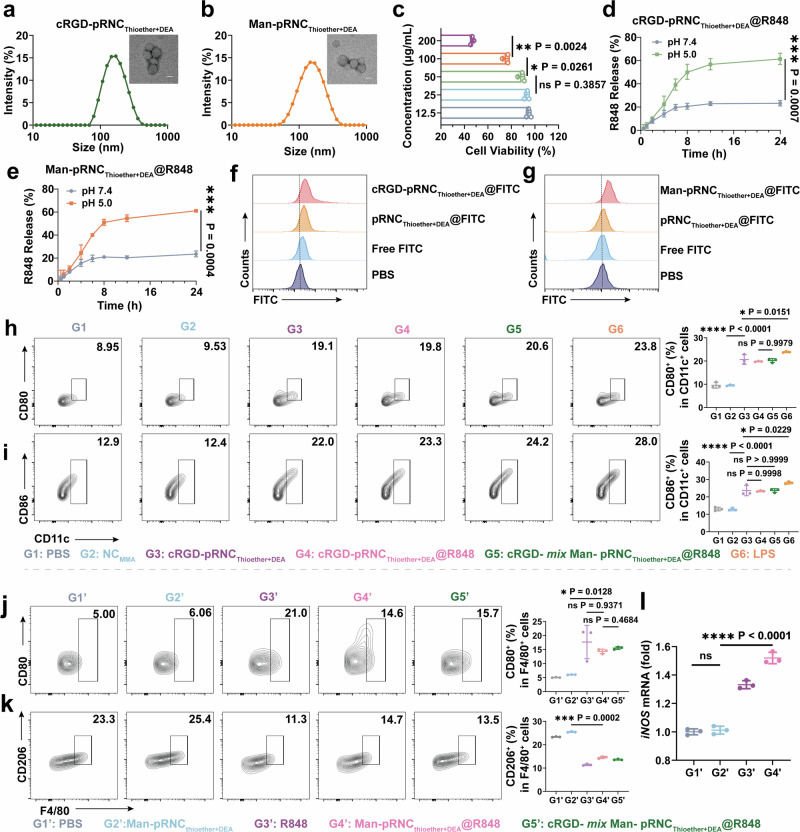
Fig. 4. Preparation and characterization of targeted nanoformulations.
a, b Diameters and representative transmission electron microscopy images of cRGD-pRNCThioether+DEA and Man-pRNCThioether+DEA. Scale bar, 100 nm. Three times was repeated independently with similar results. c Dosage dependent cytotoxicity of Man-pRNCThioether+DEA in RAW264.7 cells by MTT assays characterization. Data are shown as mean ± SD (n = 3 independent experiments). d, e In vitro R848 release from cRGD-pRNCThioether+DEA or Man-pRNCThioether+DEA within 24 h at different pH values (pH 7.4 or pH 5.0). Data are shown as Geometric mean ± 95% CI. (n = 3 independent experiments). f Representative flow cytometric plots showing the cellular uptake of pRNCThioether+DEA, cRGD-pRNCThioether+DEA and free FITC in B16F10 cells. g Representative flow cytometric plots showing the cellular uptake of pRNCThioether+DEA, Man-pRNCThioether+DEA and free FITC in RAW264.7 cells. h, i Representative flow cytometric images and quantification of mature DCs. Data are shown as mean ± SD (n = 3 independent experiments). j, k Representative flow cytometric images and quantification of polarization of macrophages. Data are shown as mean ± SD (n = 3 independent experiments). l Expression of iNOS in cells after different treatments (n = 3 independent experiments). The word “ns” represented non-significance, and *P < 0.05; **P < 0.01; ***P < 0.001. Data are presented as mean ± SD. Statistical significance was calculated through one-way ANOVA for multiple comparisons using a Tukey post-hoc test.

