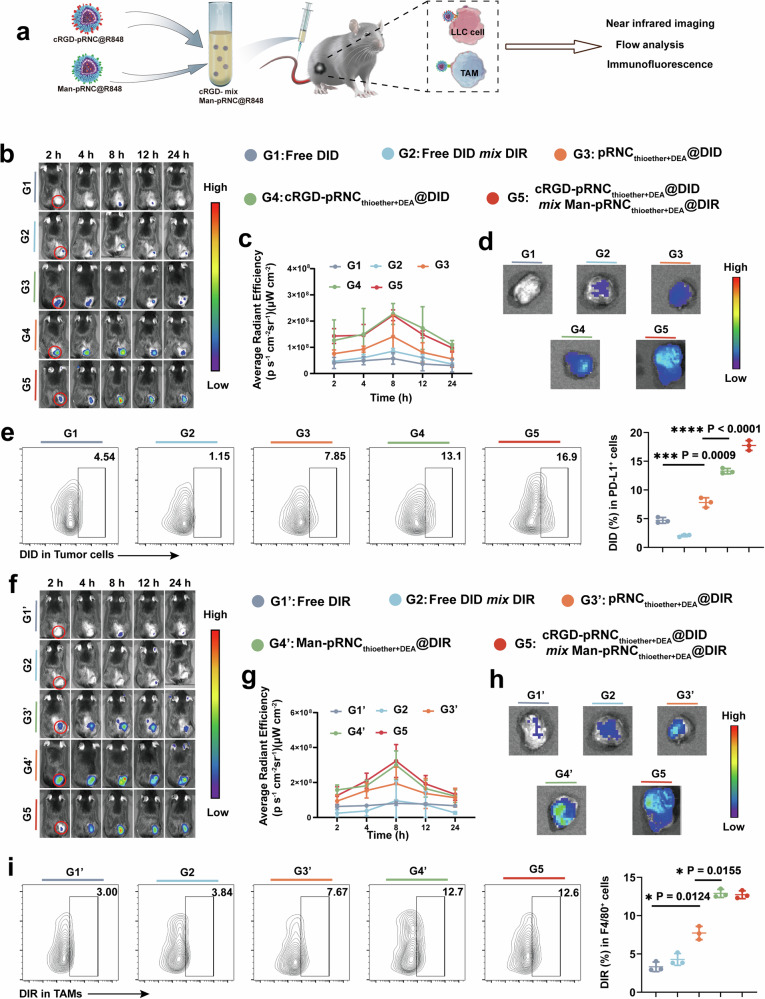
Fig. 5. Investigation of mixed nanoformulations for targeting both tumor cells and TAMs in vivo.
a Schematic illustration of mixed nanoformulation preparation, drug administration and analysis. b In vivo fluorescence imaging after tail vein injection of different formulations for cRGD targeting investigation. c Quantitative analysis of fluorescence signals at 24 h post-treatment (n = 3 mice per group). d Representative ex vivo images of tumor tissues after treatments at 24 h. e Representative flow cytometric images and quantification of DID+ in PD-L1+ tumor cells in vivo (n = 3 mice per group). f In vivo fluorescence imaging after tail vein injection of different formulations for Man targeting investigation. g Quantitative analysis of fluorescence signals at 24 h (n = 3 mice per group). h Representative ex vivo images of tumor tissues. i Representative flow cytometric images and semi-quantification analysis of DIR+ in F4/80+ TAMs cells in vivo (n = 3 mice per group). Data are presented as mean ± SD. Statistical significance was calculated through one-way ANOVA for multiple comparisons using a Tukey post-hoc test.

