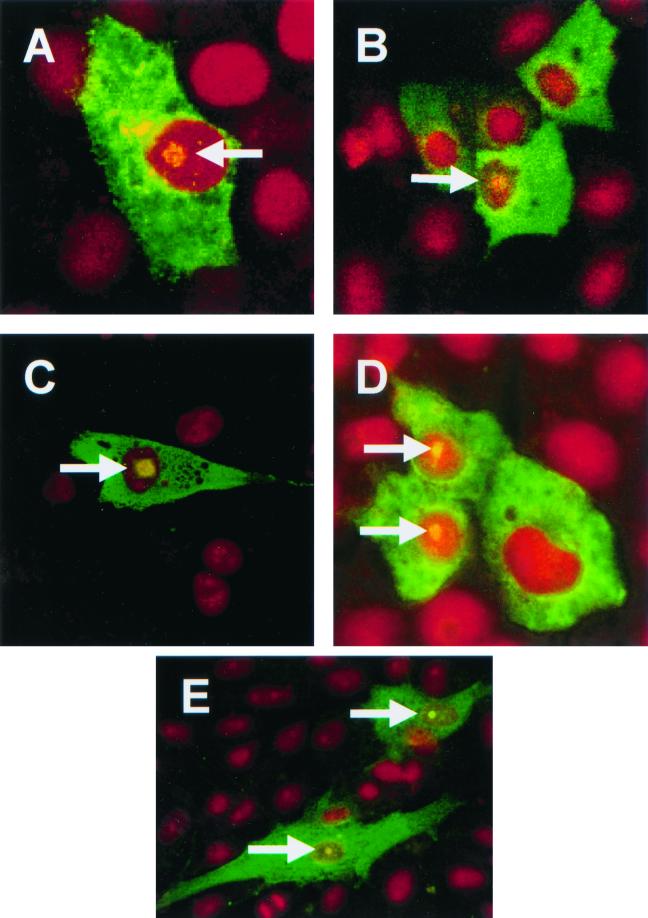
FIG. 1.
Indirect detection of TGEV (A and B) and MHV (C and D) N proteins in transfected cells and the IBV (E) N protein in transduced cells by immunofluorescence. LLC-PK1 cells (A), L cells (C), and Vero cells (B and D) were transfected with either pCi-TGEV-N or pCi-MHV-N or were transduced with BacIBVN (E). They were incubated for 24 h, fixed, and analyzed by indirect immunofluorescence using appropriate antibodies (green) (see text). Additionally, cells were stained with PI to directly visualize nuclear DNA (red). Differentially fluorescing images were gathered separately from the same 0.5-μm-thick optical section by using a confocal microscope and the appropriate filter. The two images were digitally superimposed to depict the distribution of the appropriate coronavirus N protein and nuclear DNA. Arrow, position of a nucleolus. Magnifications, ×62 (A to D) and ×16 (2.73 zoom) (E).

