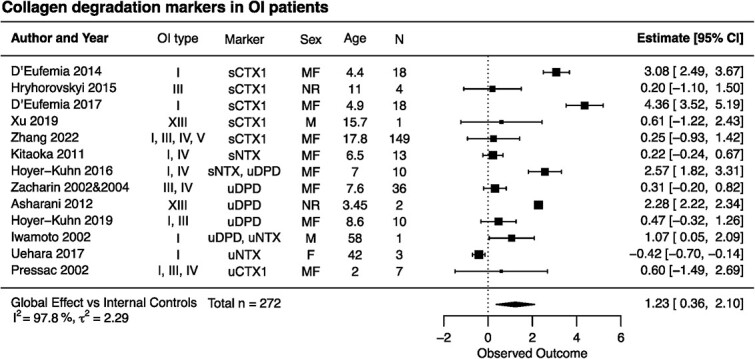
Figure 2.

Forest plot of the differences in collagen degradation markers between patients with osteogenesis imperfecta (OI) and healthy controls. Indicated are the included studies; the OI type for reported patients; markers measured in the study; sex of patients as male (M), female (F), or mixed group of male and female (MF) and not reported (NR); average age of patients; and the number of patients. The standardized mean differences with 95% CIs for individual studies are depicted as squares/lines; the square size is proportional to the study’s weight. Diamonds/bands represent the global effect size and CI. A positive difference reflects higher values in OI. The heterogeneity statistics I2 and τ2 are reported.
