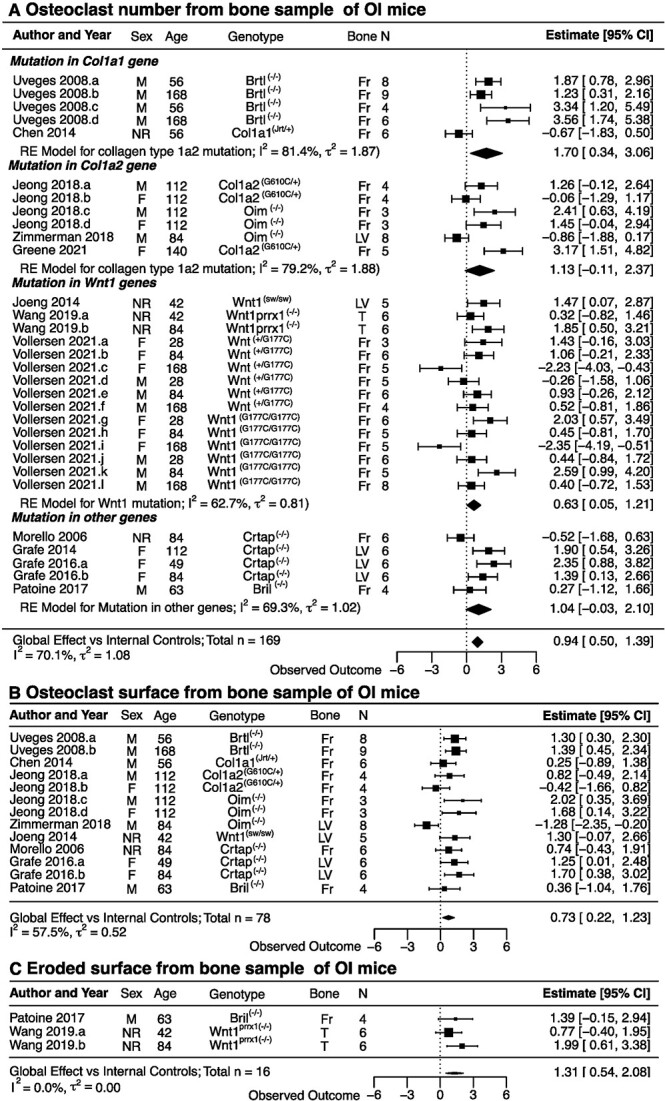
Figure 6.

The differences in histomorphometric osteoclast parameters between osteogenesis imperfecta (OI) mice and healthy controls. (A–C) Forest plots of the differences in osteoclast numbers (A), osteoclast surface (B), and eroded surface (C) between OI mice and healthy controls. Indicated are the included studies; animal sex (male [M], female [F], or not reported [NR]); age and genotype; bone analyzed (femur [F], lumbar vertebrae [LV], or tibia [T]); and sample size. The standardized mean differences with 95% CIs for individual studies are depicted as squares/lines; the square size is proportional to the study’s weight. Diamonds/bands are global effect sizes and CI. A positive difference reflects higher values in OI. The heterogeneity statistics I2 and τ2 are reported. Abbreviation: RE, random effects.
