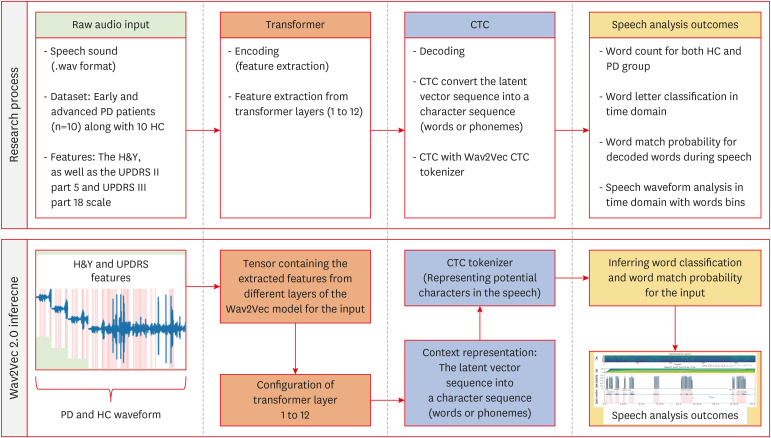
FIGURE 1. Research flow chart and the process of obtaining speech-to-text analysis outcomes using the Wav2Vec inference model to analyze the features between PD and HC for this study. HC and PD group were used and encoding and decoding process were employed in speech analysis procedure.
HC: healthy control, PD: Parkinson’s disease, H&Y: Hoehn and Yahr, UPDRS: Unified Parkinson’s Disease Rating Scale, CTC: Connectionist Temporal Classification.

