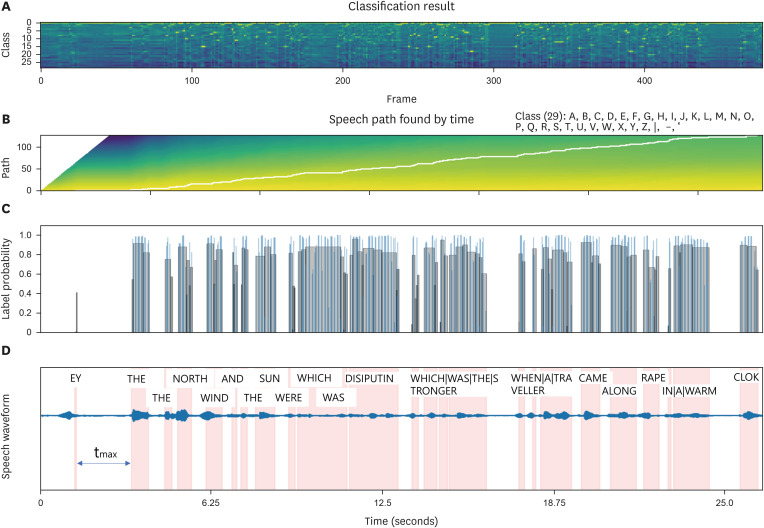
FIGURE 2. Visualization and analysis of inference results for speech sound model output in HC. (A) The inference findings for instances identified as female, H&Y 0, UPDRS II-part 5 score of 0, and UPDRS III-part 18 score of 0 within the HC group. The corresponding class for each of 500 frames along the time axis of the waveform. (B) The trajectory for detecting words decoded from vocalized sounds is visually depicted. (C) The probability at the detection juncture in the time domain. (D) The decoded words are superimposed onto the waveform within the time domain. And a maximum delay (tmax), 3.15 seconds was identified.
HC: healthy control, H&Y: Hoehn and Yahr, UPDRS: Unified Parkinson’s Disease Rating Scale, tmax: maximum delay time.

