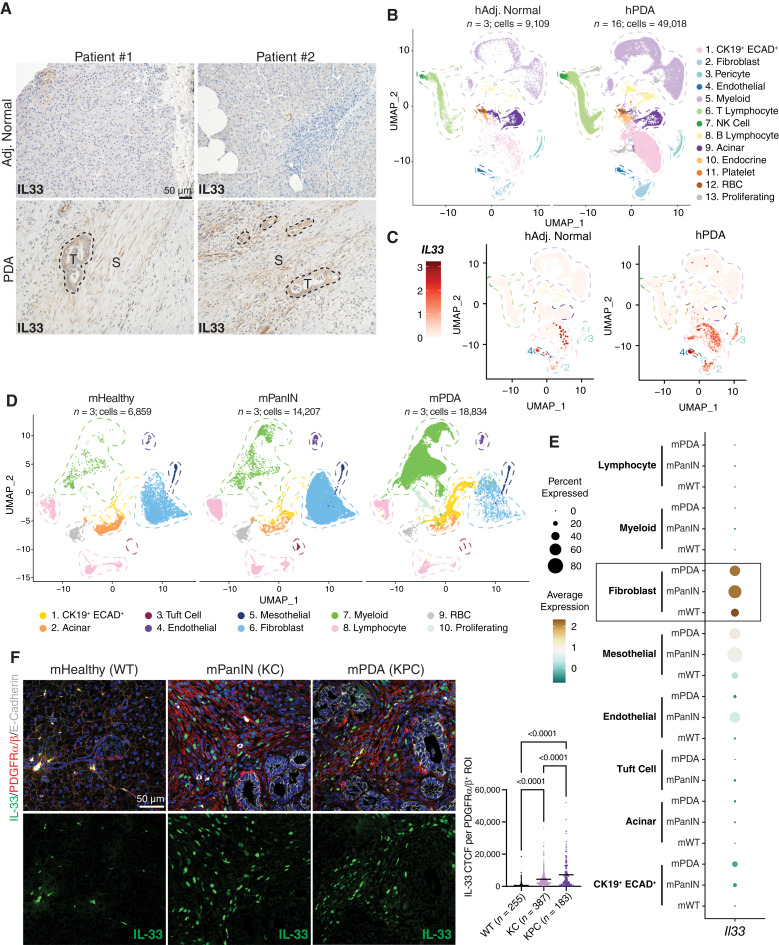
Figure 1.
IL33+ stromal cells are abundant in human and mouse PDA. A, Human IHC staining of IL33 in matched adjacent normal (“Adj. Normal”) and PDA regions. S, stromal area; T, tumor area. B, UMAP visualization of human scRNA-seq dataset split into adjacent normal and PDA groups. n = number of patients in each dataset. C, Feature plot of IL33 transcription levels in human scRNA-seq. D, UMAP visualization of murine scRNA-seq dataset split into healthy, PanIN, and PDA groups. E, Dot plot representation of Il33 transcription levels across cell types in the murine scRNA-seq dataset. F, Co-IF staining of murine tissues [healthy (wildtype) aka WT, PanIN aka KC (Ptf1a-Cre; LSL-KrasG12D), and PDA aka KPC (Ptf1a-Cre; Trp53R172H/+;LSL-KrasG12D)]. IL33 (green), PDGFRα/β (red), E-Cadherin (white), DAPI (blue). IL33 CTCF was quantified per individual ROI; each ROI encompasses one PDGFRα/β+ cell. N = 3 mice were quantified per group. N in the figure represents the number of ROIs measured per group. P values represent one-way ANOVA testing between groups. Line = mean CTCF.

