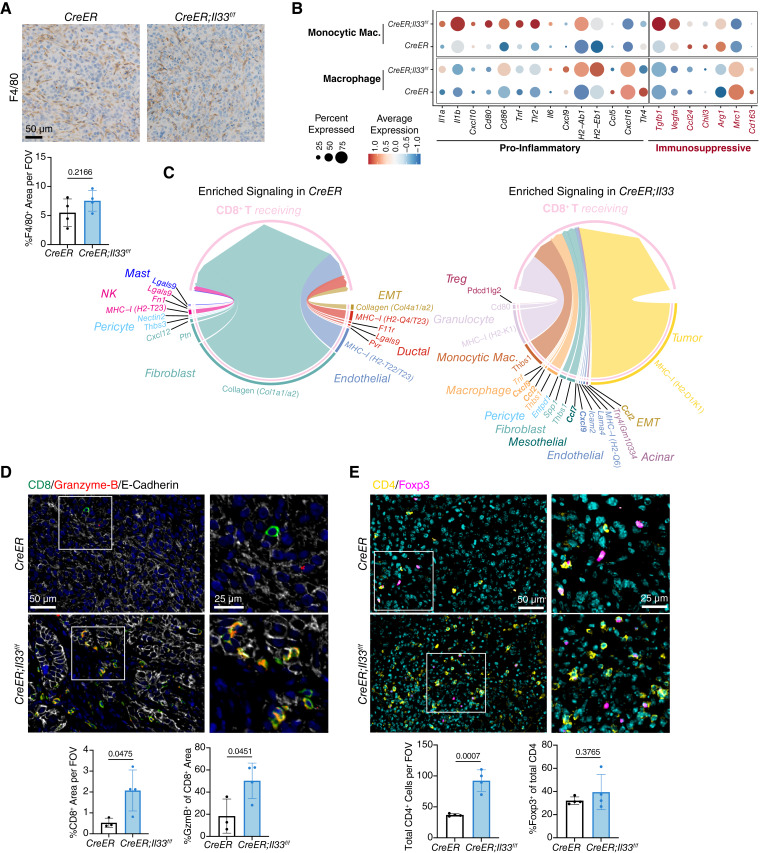
Figure 4.
Inactivation of stromal IL33 enables cytotoxic T-cell activity. A, IHC staining of F4/80 in CreER and CreER; Il33f/f tumors. B, scRNA-seq gene expression of curated proinflammatory and immunosuppressive markers, grouped by cell type and split by experimental group. C, Chord diagram visualizing ligands differentially enriched (Bonferroni-corrected P value < 0.05 and fold-change ≥0.25) in CreER and CreER;Il33f/f tumors that interact with CD8+ T cells. Edge widths are proportional to predicted interaction strength. Chemokines are bolded. D and E, Co-IF staining of CreER and CreER;Il33f/f tumors: (D) = CD8 (green), Granzyme-B (red), E-Cadherin (white) and DAPI (blue), (E) = CD4 (yellow), Foxp3 (magenta), and DAPI (cyan). For staining quantification, each dot represents one animal, and values were compared using a two-tailed Student t test. Histogram data are mean ± standard deviation.

