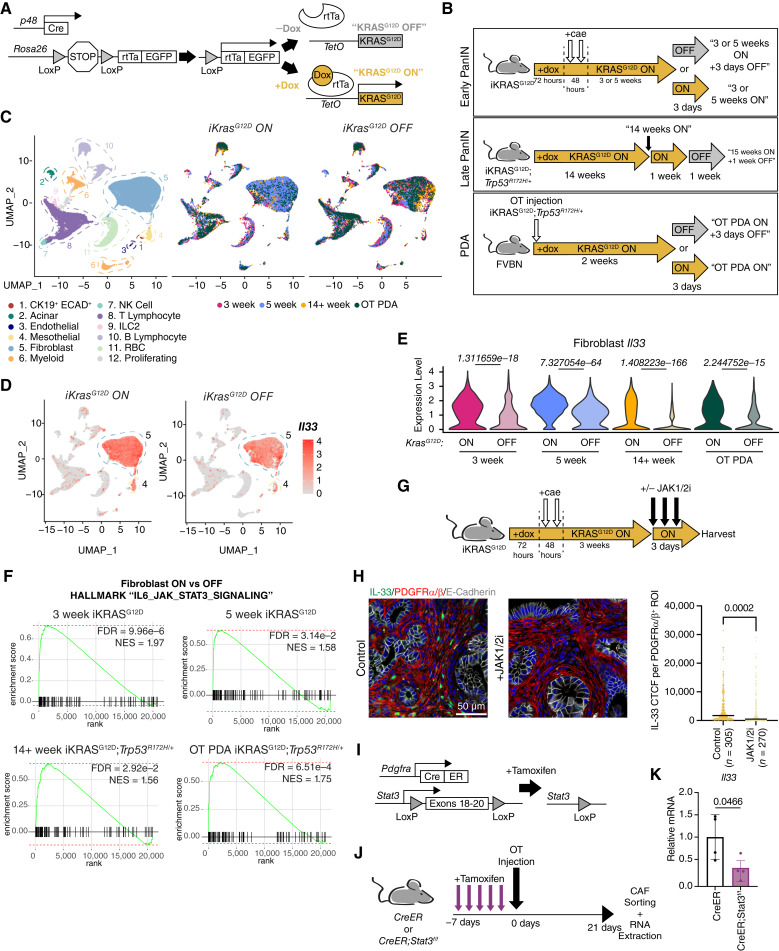
Figure 5.
Expression of fibroblast IL33 is extrinsically induced by epithelial KRASG12D and requires JAK1/2-STAT3 activation throughout tumorigenesis. A, Genetic scheme of the iKRASG12D mouse. Doxycycline induces reversible expression of KRASG12D in pancreatic epithelial cells. B, Diagram representing the various iKRASG12D treatment models and collection points across tumorigenesis. Cae, caerulein; OT, orthotopic. C, UMAP visualization of iKRASG12D scRNA-seq dataset. Projection on the left is colored by cell type (all datasets merged). Projections on the right are split by iKRASG12D “ON” and “OFF” status and are colored by timepoint. D, Feature plot representation of Il33 expression levels split by iKRASG12D “ON” and “OFF” status (all timepoints merged). E, Violin plots depicting fibroblast Il33 expression level per timepoint and split by iKRASG12D “ON” and “OFF” status. Wilcoxon rank sum tests were performed between iKRASG12D “ON” and “OFF” pairings per each timepoint, and Bonferroni adjusted P values are displayed above violins. F, GSEA enrichment plots of the Hallmark “IL6_JAK_STAT3_SIGNALING” pathway based on fibroblast iKRASG12D “ON” and “OFF” differential gene expression analysis within each timepoint. G, Treatment scheme for iKRASG12D “ON” model + JAK1/2 inhibitor. H, Co-IF staining of IL33 (green), PDGFRα/β (red), E-Cadherin (white), DAPI (blue). IL33 CTCF was quantified per individual ROI; each ROI encompasses one PDGFRα/β+ cell. N = 3 mice were quantified per group. N in the figure represents the number of ROIs measured per group. P values represent a two-tailed Student t test. Line = Mean CTCF. I, Genetic scheme of Pdgfra-CreERT2/+;Stat3f/f (CreER;Stat3f/f) murine model. Tamoxifen induces activation of the Cre-ERT2 fusion protein, allowing recombination to occur. J, Diagram representing the treatment schedule for the CreER;Stat3f/f orthotopic tumor model. K, Expression levels of Il33 in CAFs from J as measured by RT-qPCR. Values are normalized to Ppia (Cyclophilin A) and relative to the CreER group. Two-tailed Student t test was performed to compare groups; data are mean ± standard deviation.

