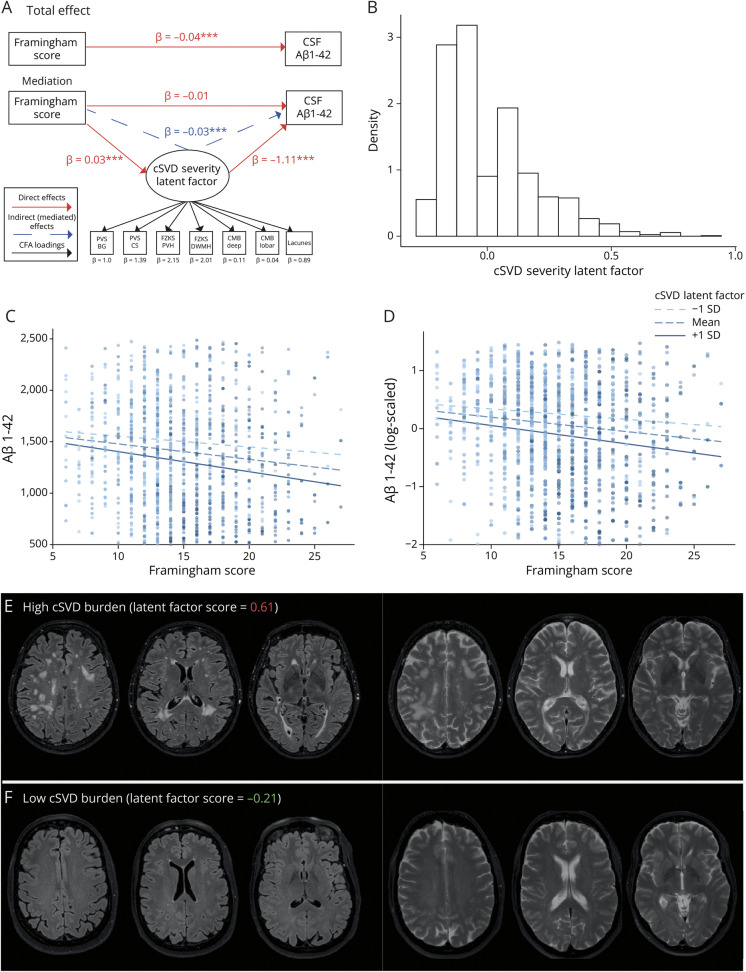
Figure 1. Mediation Analysis and cSVD Burden Latent Factor.
(A) Illustration of the mediation analysis, including total and mediated effects. After SEM convention, observed variables are depicted as rectangles and latent variables as ovals. Red arrows are used to illustrate direct effects. Blue arrows are used to illustrate indirect (mediated) effects. Black arrows are used to illustrate confirmatory factor analysis (CFA) loadings. *p < 0.05, **p < 0.01, and ***p < 0.001. (B) Distribution (histogram) of the estimated cSVD latent factor through CFA. (C) Association between Framingham scores and raw CSF Aβ1-42 values stratified by scores at the cSVD latent factor. (D) Association between Framingham scores and log-scaled CSF Aβ1-42 values stratified by scores at the cSVD latent factor. (E) Illustration of FLAIR and T2w scans from a participant with a high score in the cSVD latent factor. (F) Illustration of FLAIR and T2w scans from a participant with a low score in the cSVD latent factor. CMB = cerebral microbleed; cSVD = cerebral small vessel disease; D = deep; FZKS DWMH = Fazekas deep white matter hyperintensity; PV = periventricular; FZKS PVH = Fazekas periventricular hyperintensity; PVS-BG = perivascular spaces in basal ganglia; PVS-CS = perivascular spaces in centrum semiovale.

