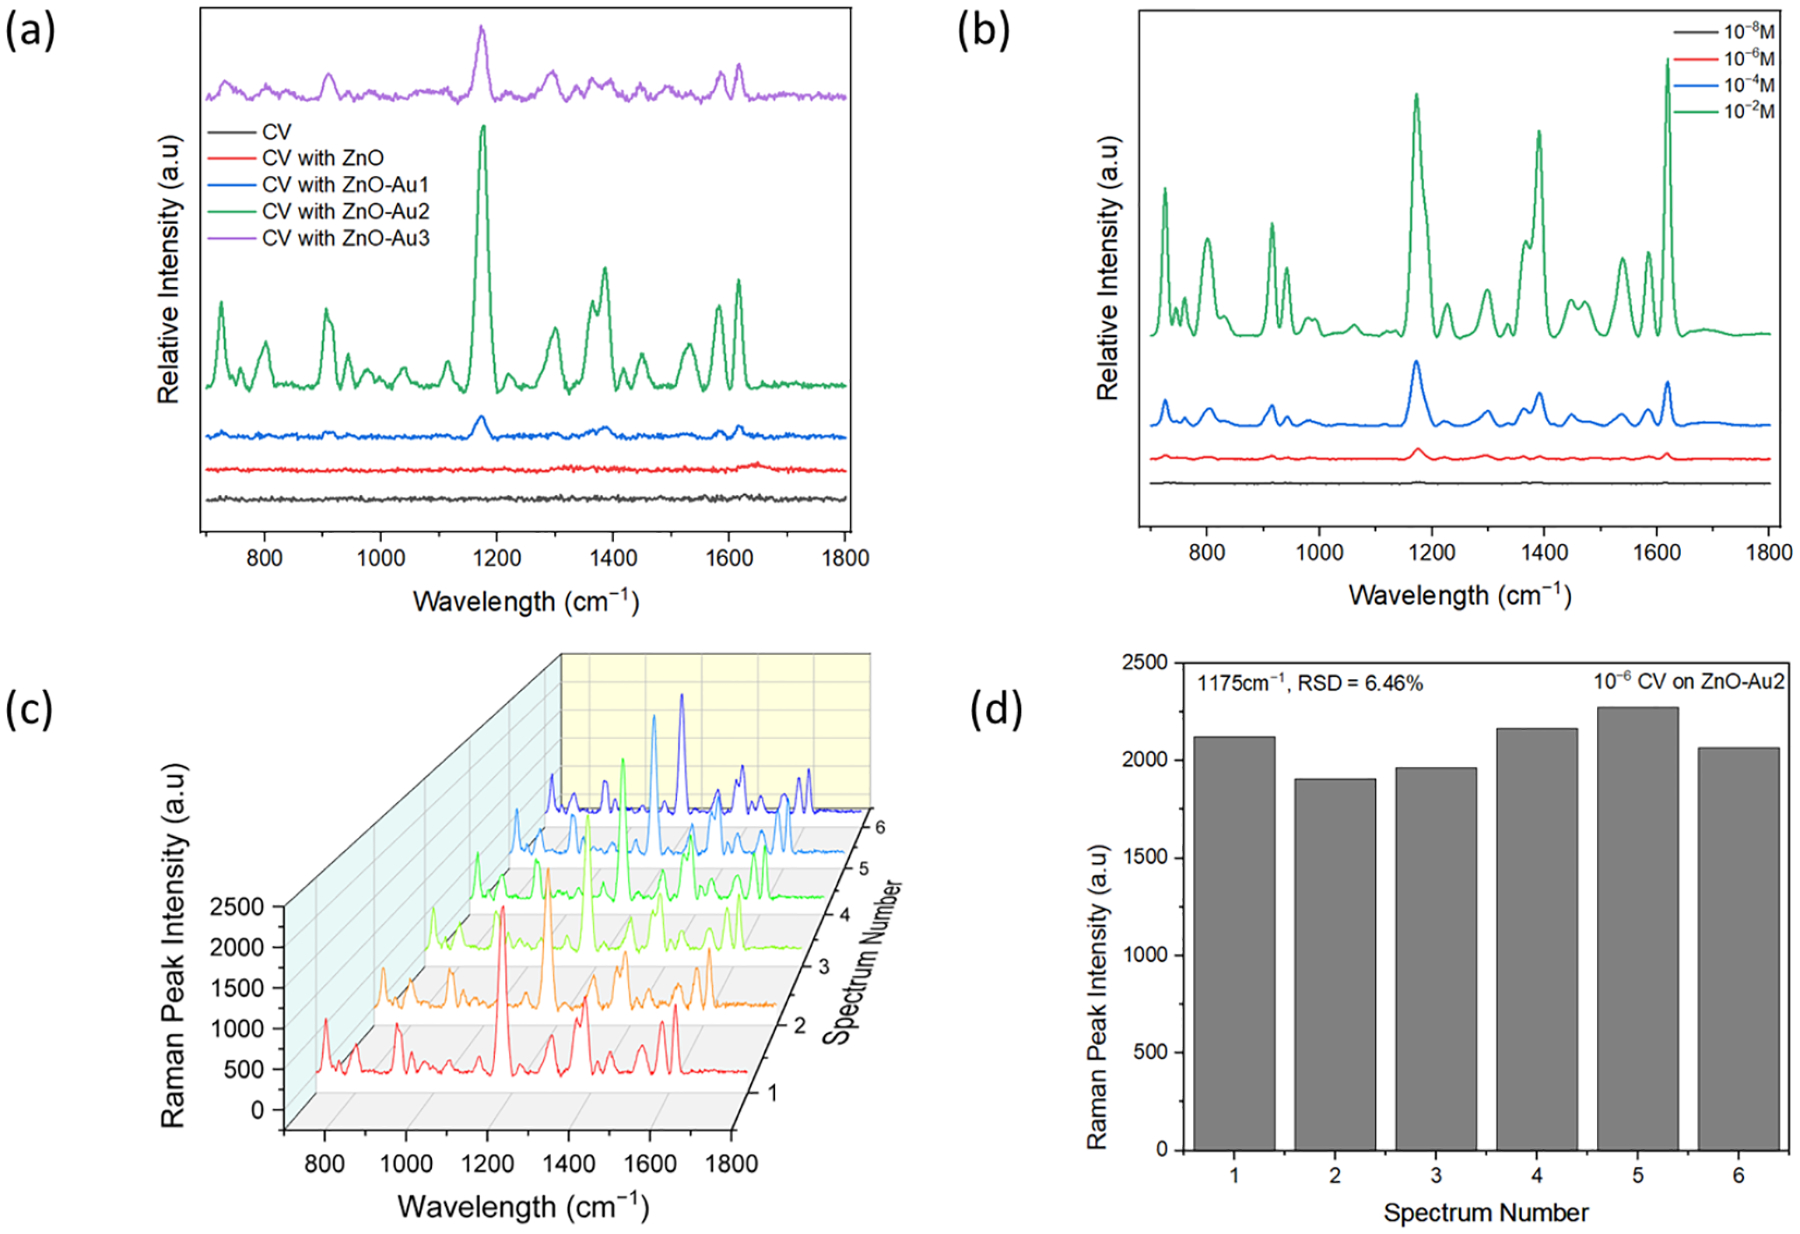
Figure 5.

(a) SERS spectra of 10−6 M crystal violet (CV) on pure ZnO and ZnO-Au substrates. (b) SERS spectra of different concentrations of CV on the optimal substrate (ZnO-Au2). (c) SERS spectra of six random measurement of 10−6 M CV on optimal substrate. (d) SERS peak intensity at wavelength 1175 cm−1 of the six random measurements of 10−6 M CV on optimal substrate.
