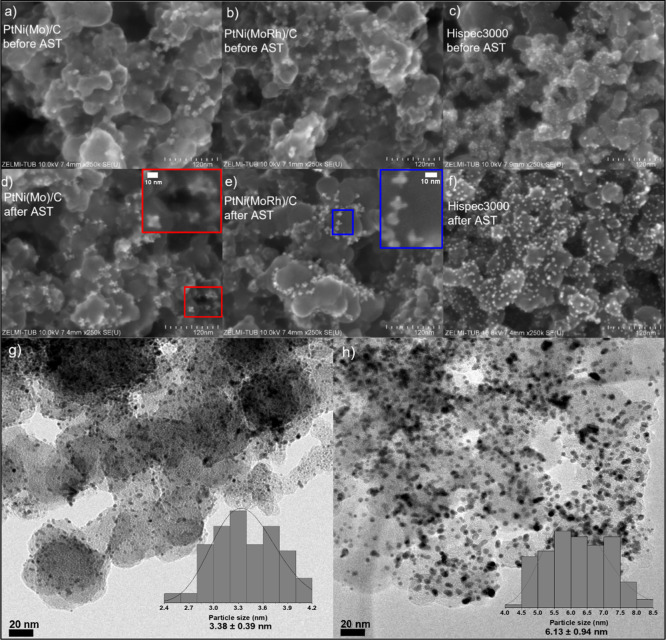
Figure 4.
SEM images with a magnification of 250k of the as-prepared (a) Ni-rich Mo-doped oh-PtNi NPs, (b) Ni-rich MoRh-doped oh-PtNi, and (c) Pt/C HiSPEC 3000 catalysts collected with the secondary electron detector and of the corresponding tested catalysts (after the AST) in (d–f), respectively. The colored insets in panels (d,e) highlight the zoomed-in views of the aged Mo- (red) and MoRh-doped (blue) oh-PtNi NPs. Bright-field TEM images of Pt/C HiSPEC 3000 NPs (g) before and (h) after the AST and the particle size distribution in the insets.

