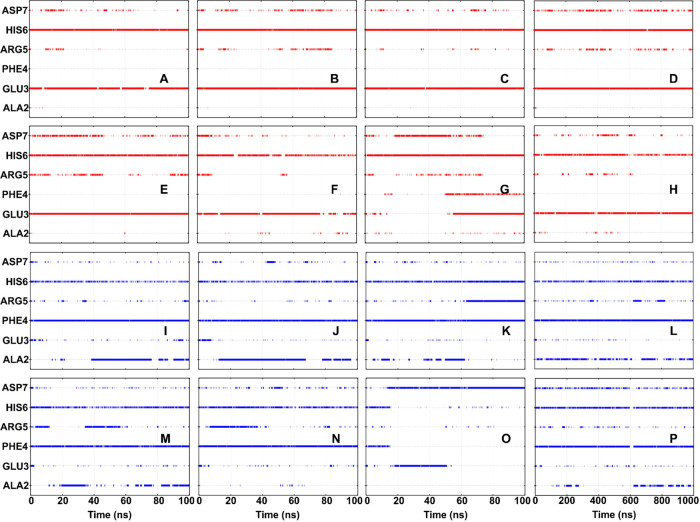
Figure 4.
Hydrogen bond profile of the Aβ2–7 residues with the aducanumab (A–H) heavy chain and (I–P) light chain over the entire period of the simulations. Data of simulations (A, I) MD1, (B, J) MD2, (C, K) MD3, (D, L) LMD-Wild, (E, M) MD4, (F, N) MD5, (G, O) MD6, and (H, P) LMD-Mut are represented.

