Figure 6.

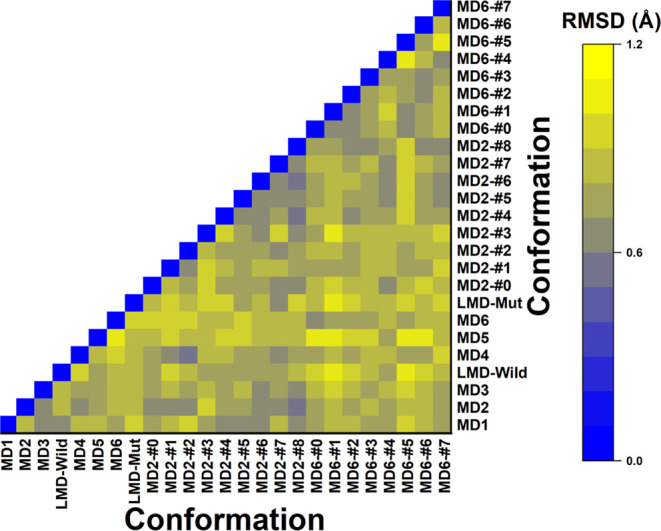
Heatmap of RMSD values between Aducanumab::Aβ2–7 conformations. The caption for the correlation of colors and RMSD values is on the right panel of the graph.

Heatmap of RMSD values between Aducanumab::Aβ2–7 conformations. The caption for the correlation of colors and RMSD values is on the right panel of the graph.