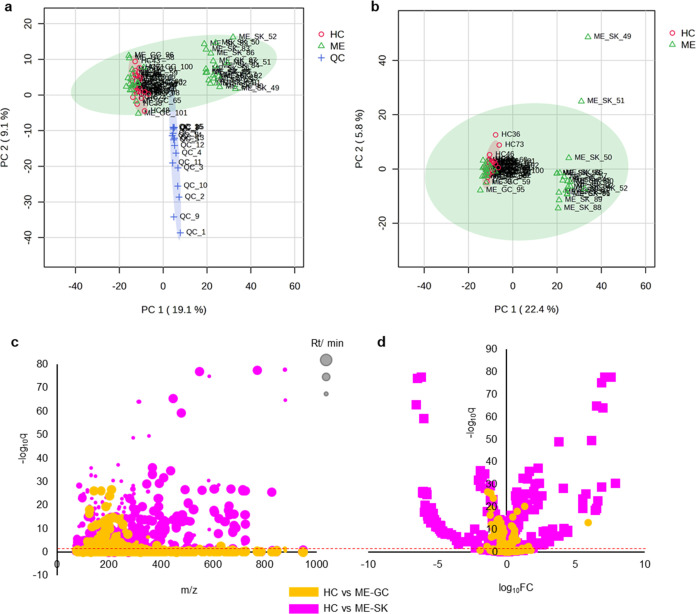
Figure 1.
PCA plots are presented to show the distribution of QC, HC, and ME samples. Panel (a) illustrates PC1 (19.1% variance) and PC2 (9.1% variance), with QC samples clustering centrally along PC1 but separating along PC2. Panel (b) highlights that the Stockholm (SK) cohort of the ME/CFS patients is distinct from other plasma samples. Panels (c, d) depict significant metabolite changes, with 115 features differentiating HC and ME/CFS patients from Gothenburg cohort (ME-GC), and 522 features differentiating HC and ME-SK, corroborating the PCA’s indication of high discrimination in the ME-SK cohort.

