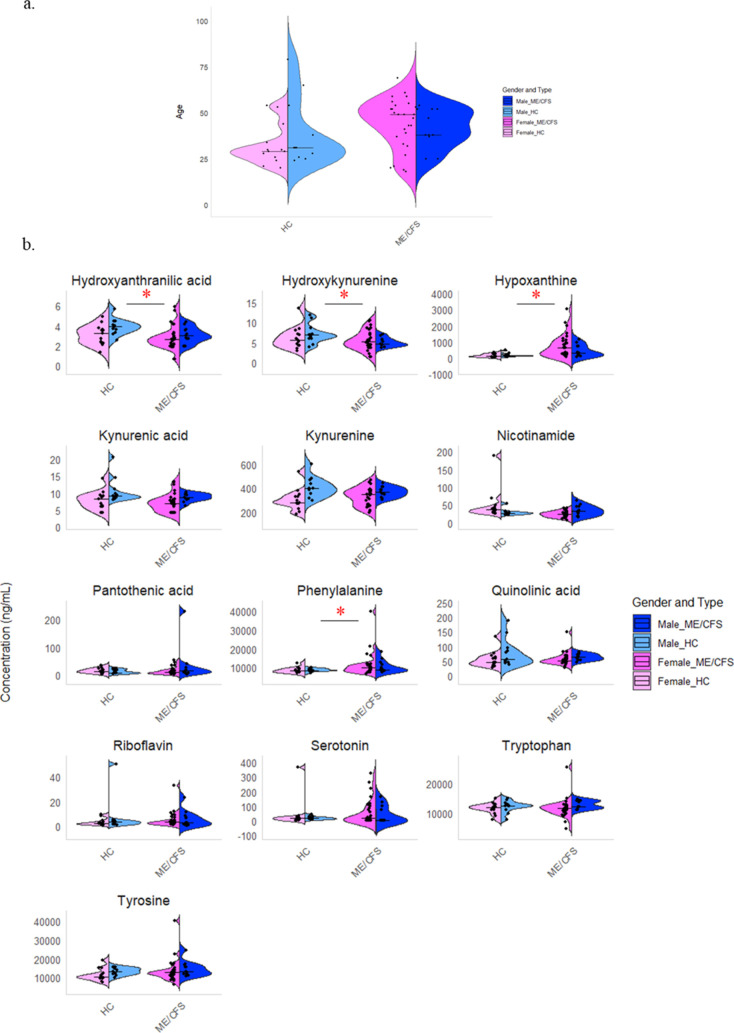
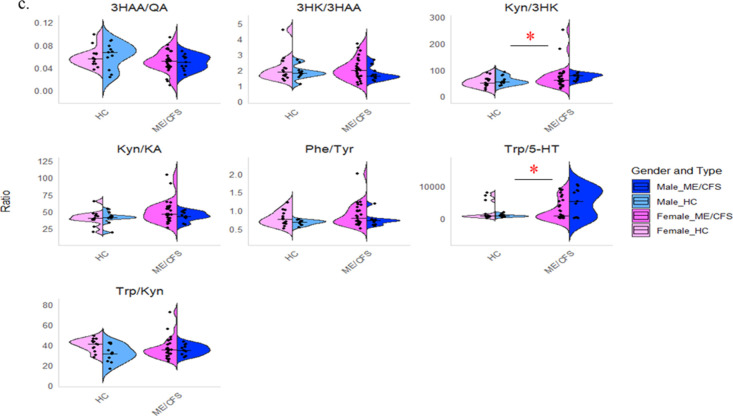
Figure 2.
Violin plots of ME/CFS and healthy controls (HC) separated into males and females. (a) A violin plot of age distribution for 24 presumed HC, (13 females and 11 males) and 38 ME/CFS patients (27 females and 11 males), separated by sex. The x-axis represents the cohorts, and the y-axis represents age. Each violin indicates the density of participants at different ages, with individual ages shown as dots and median age as horizontal lines. Both cohorts span a wide age range, with more participants in the middle-age range, and show sex-specific distribution patterns. (b) Presents violin plots showing the concentration distributions of various metabolites for HC and ME/CFS patients, divided by sex. Each subplot represents a different metabolite. Notably, phenylalanine and hypoxanthine concentrations are significantly higher in ME/CFS patients, while hydroxyanthranilic acid and hydroxykynurenine concentrations are lower in ME/CFS patients compared to HC. (c) Presents violin plots displaying the ratios of 3-hydroxyanthranilic acid to quinolinic acid (3HAA/QA), 3-hydroxykynurenine to 3-hydroxyanthranilic acid (3HK/3HAA), kynurenine to 3-hydroxykynurenine (Kyn/3HK), kynurenine to kynurenic acid (Kyn/KA), phenylalanine to tyrosine (Phe/Tyr), tryptophan to kynurenine (Trp/Kyn) and tryptophan to serotonin (Trp/5-HT). Notably, the ratios of Kyn/3HK and Trp/5-HT are higher in the ME/CFS cohort compared to HC. The x-axis shows the cohorts, and the y-axis shows metabolite concentration (ng/mL) or ratio. Individual data points are overlaid as dots, and horizontal lines indicate median concentrations. The red star * represents (p < 0.05).


