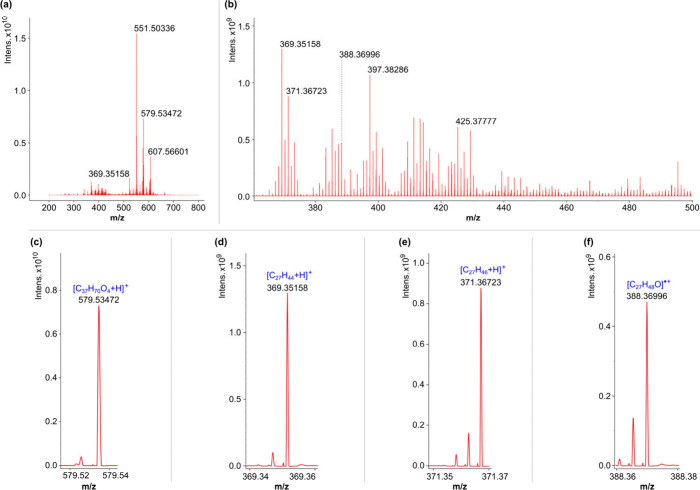
Figure 2.
(+)APPI–FT–ICR mass spectrum (phased) for the mid-Kiambio sediment sample: (a) broad overview; (b) expanded ca. m/z 360–500 region with intense contributions from suspected steroid ions; and (c–f) example peaks from selected classes of interest. The m/z values given are post recalibration.

