
Figure 3.
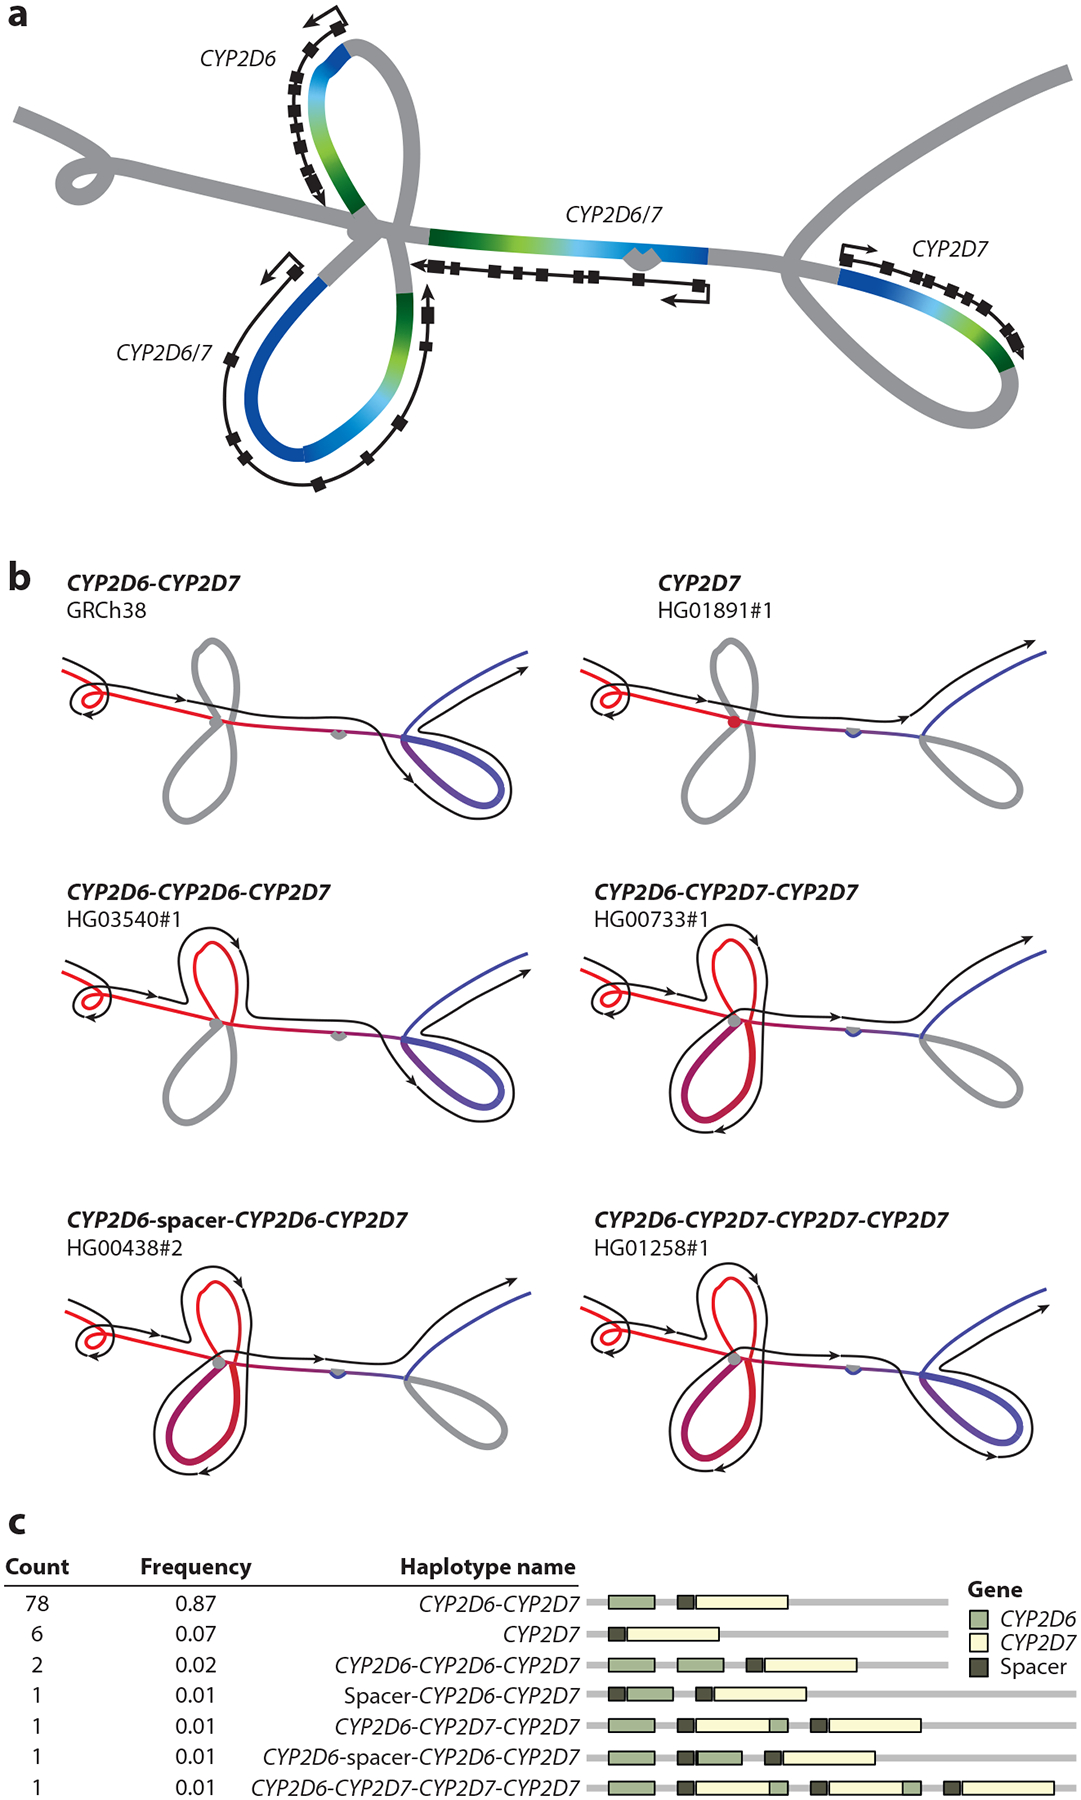
Illustrating the HPRC pangenome with an example. (a) The structural haplotypes of the CYP2D6 and CYP2D7 genes called from the Minigraph-Cactus HPRC pangenome graph. The color gradients are based on the relative positions of the genes: Green represents the head of a gene, and blue represents the end of a gene. (b) Different paths taken by different structural haplotypes in the graph. The color gradient is based on path position: Red represents the head of a path, and blue represents the end of a path. (c) Frequency and linear structural visualization of all structural haplotypes called by the Minigraph-Cactus graph. Abbreviation: HPRC, Human Pangenome Reference Consortium. Figure adapted from Reference 93 (CC BY 4.0) with assistance from Shuangjia Lu.