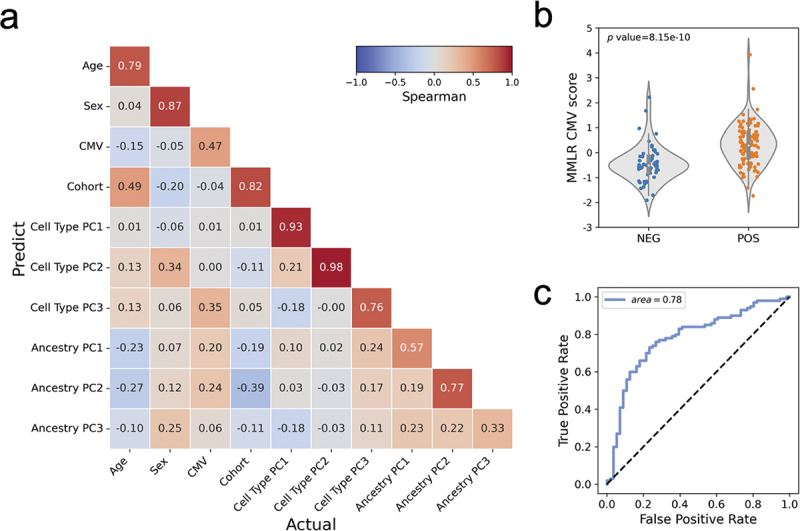
Figure 3.

Multivariate multiple linear regression methylation model.
(a) Spearman’s correlation matrix of the actual (x-axis) and predicted (y-axis) traits. (b) Violin plot with data points shows the predicted value, CMV episcore, has a significant difference in distribution between CMV seropositive and seronegative recipients. (c) ROC curve of the MMLR prediction model for CMV serostatus.
