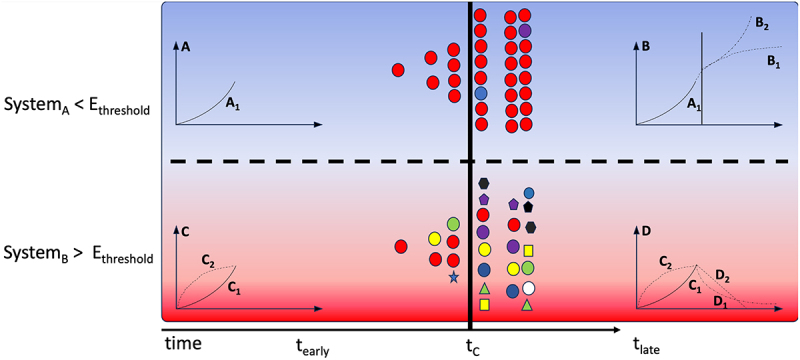
Figure 3.

Eigen’s error threshold. This is a pictorial depiction of how RNA evolution takes place in systems maintaining below Eigen’s error threshold (Ethreshold) shown in the top half of the figure. In comparison a different system is shown below that crosses the threshold. RNA molecules (red circles) starting with exponential growth reach criticality (solid black vertical line at time tC). SystemA maintained below Ethreshold reaches exponential growth (A1) in the near term (tearly) followed by stagnation in the form of a parabolic stability (B1) when there is product-dependent inhibition or emergence of another criticality leading to a subsequent exponential growth (B2) within the network of RNA molecules. Whereas, SystemB harboring a faster mutation rate, quickly switches from exponential (C1) to parabolic (C2) nature in tearly followed by exponential (D1) or linear decay (D2).
