
FIG. 11.
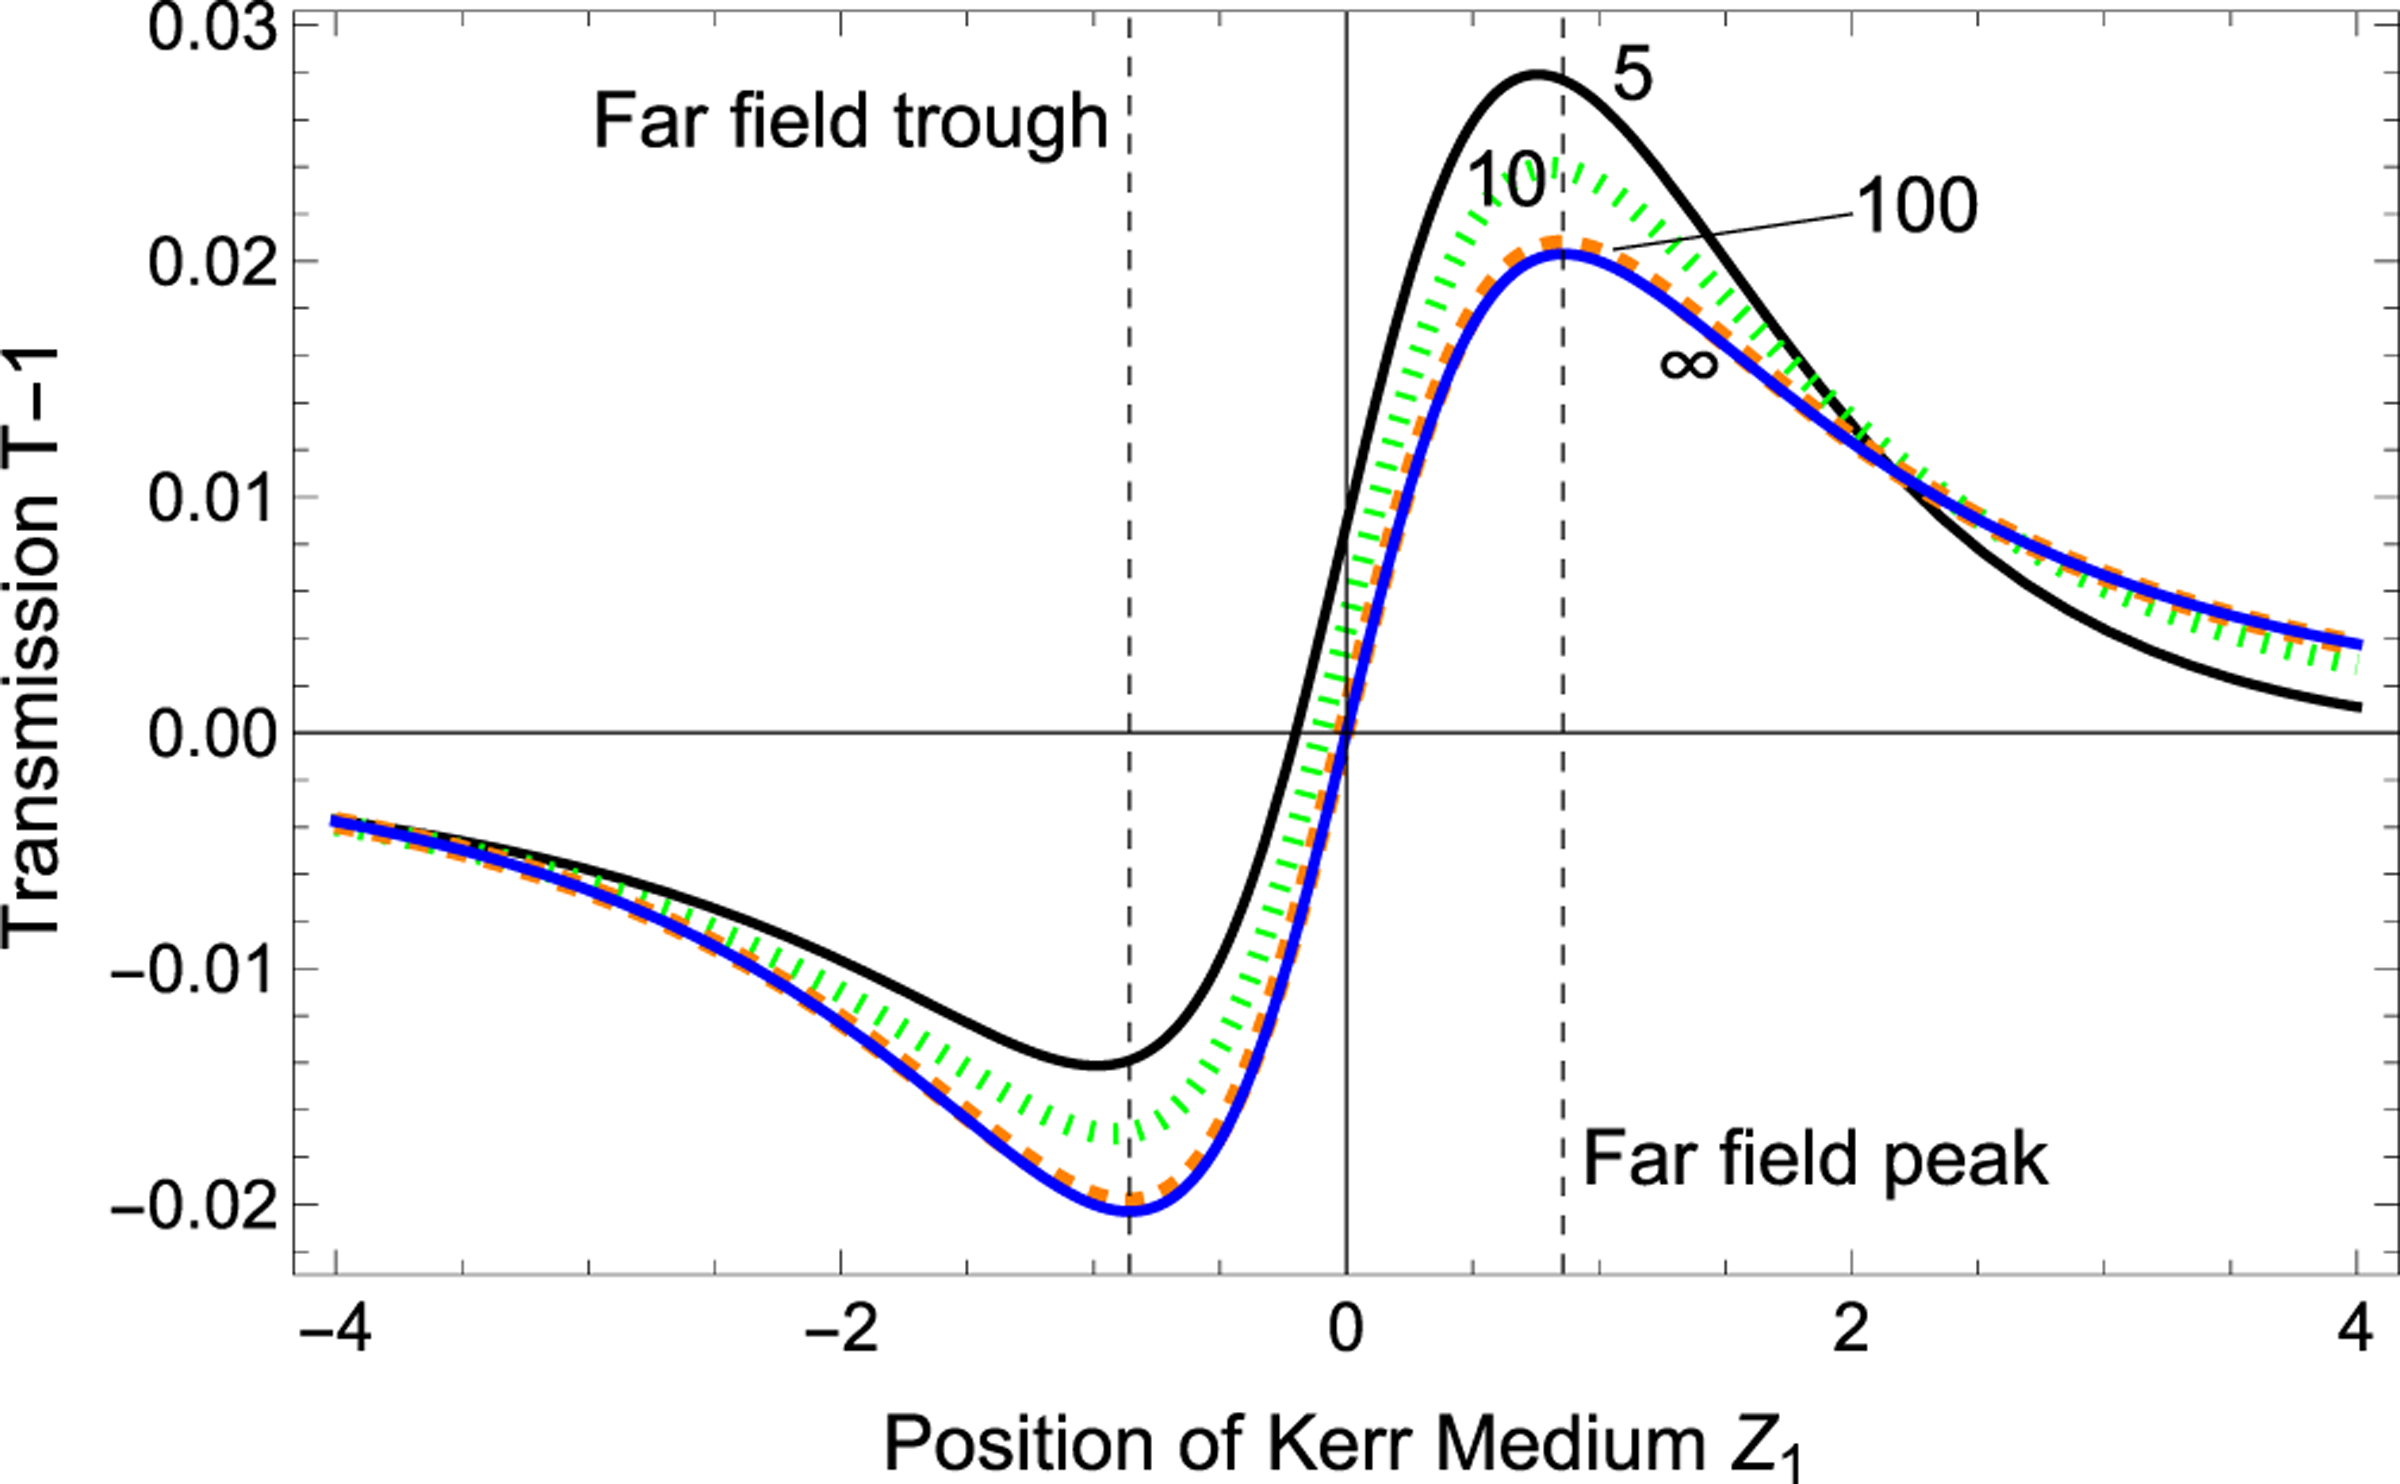
Normalized transmission curves for the scan are given with the detector at selected finite distances, (solid black) , (dotted green) , (dashed orange) , and (solid blue) or far field, as a function of the position of the Kerr medium from Eqs. (2) as and (A7). The Kerr medium is moved during a scan. The trough and peak in the far field are shown as dashed black vertical lines.