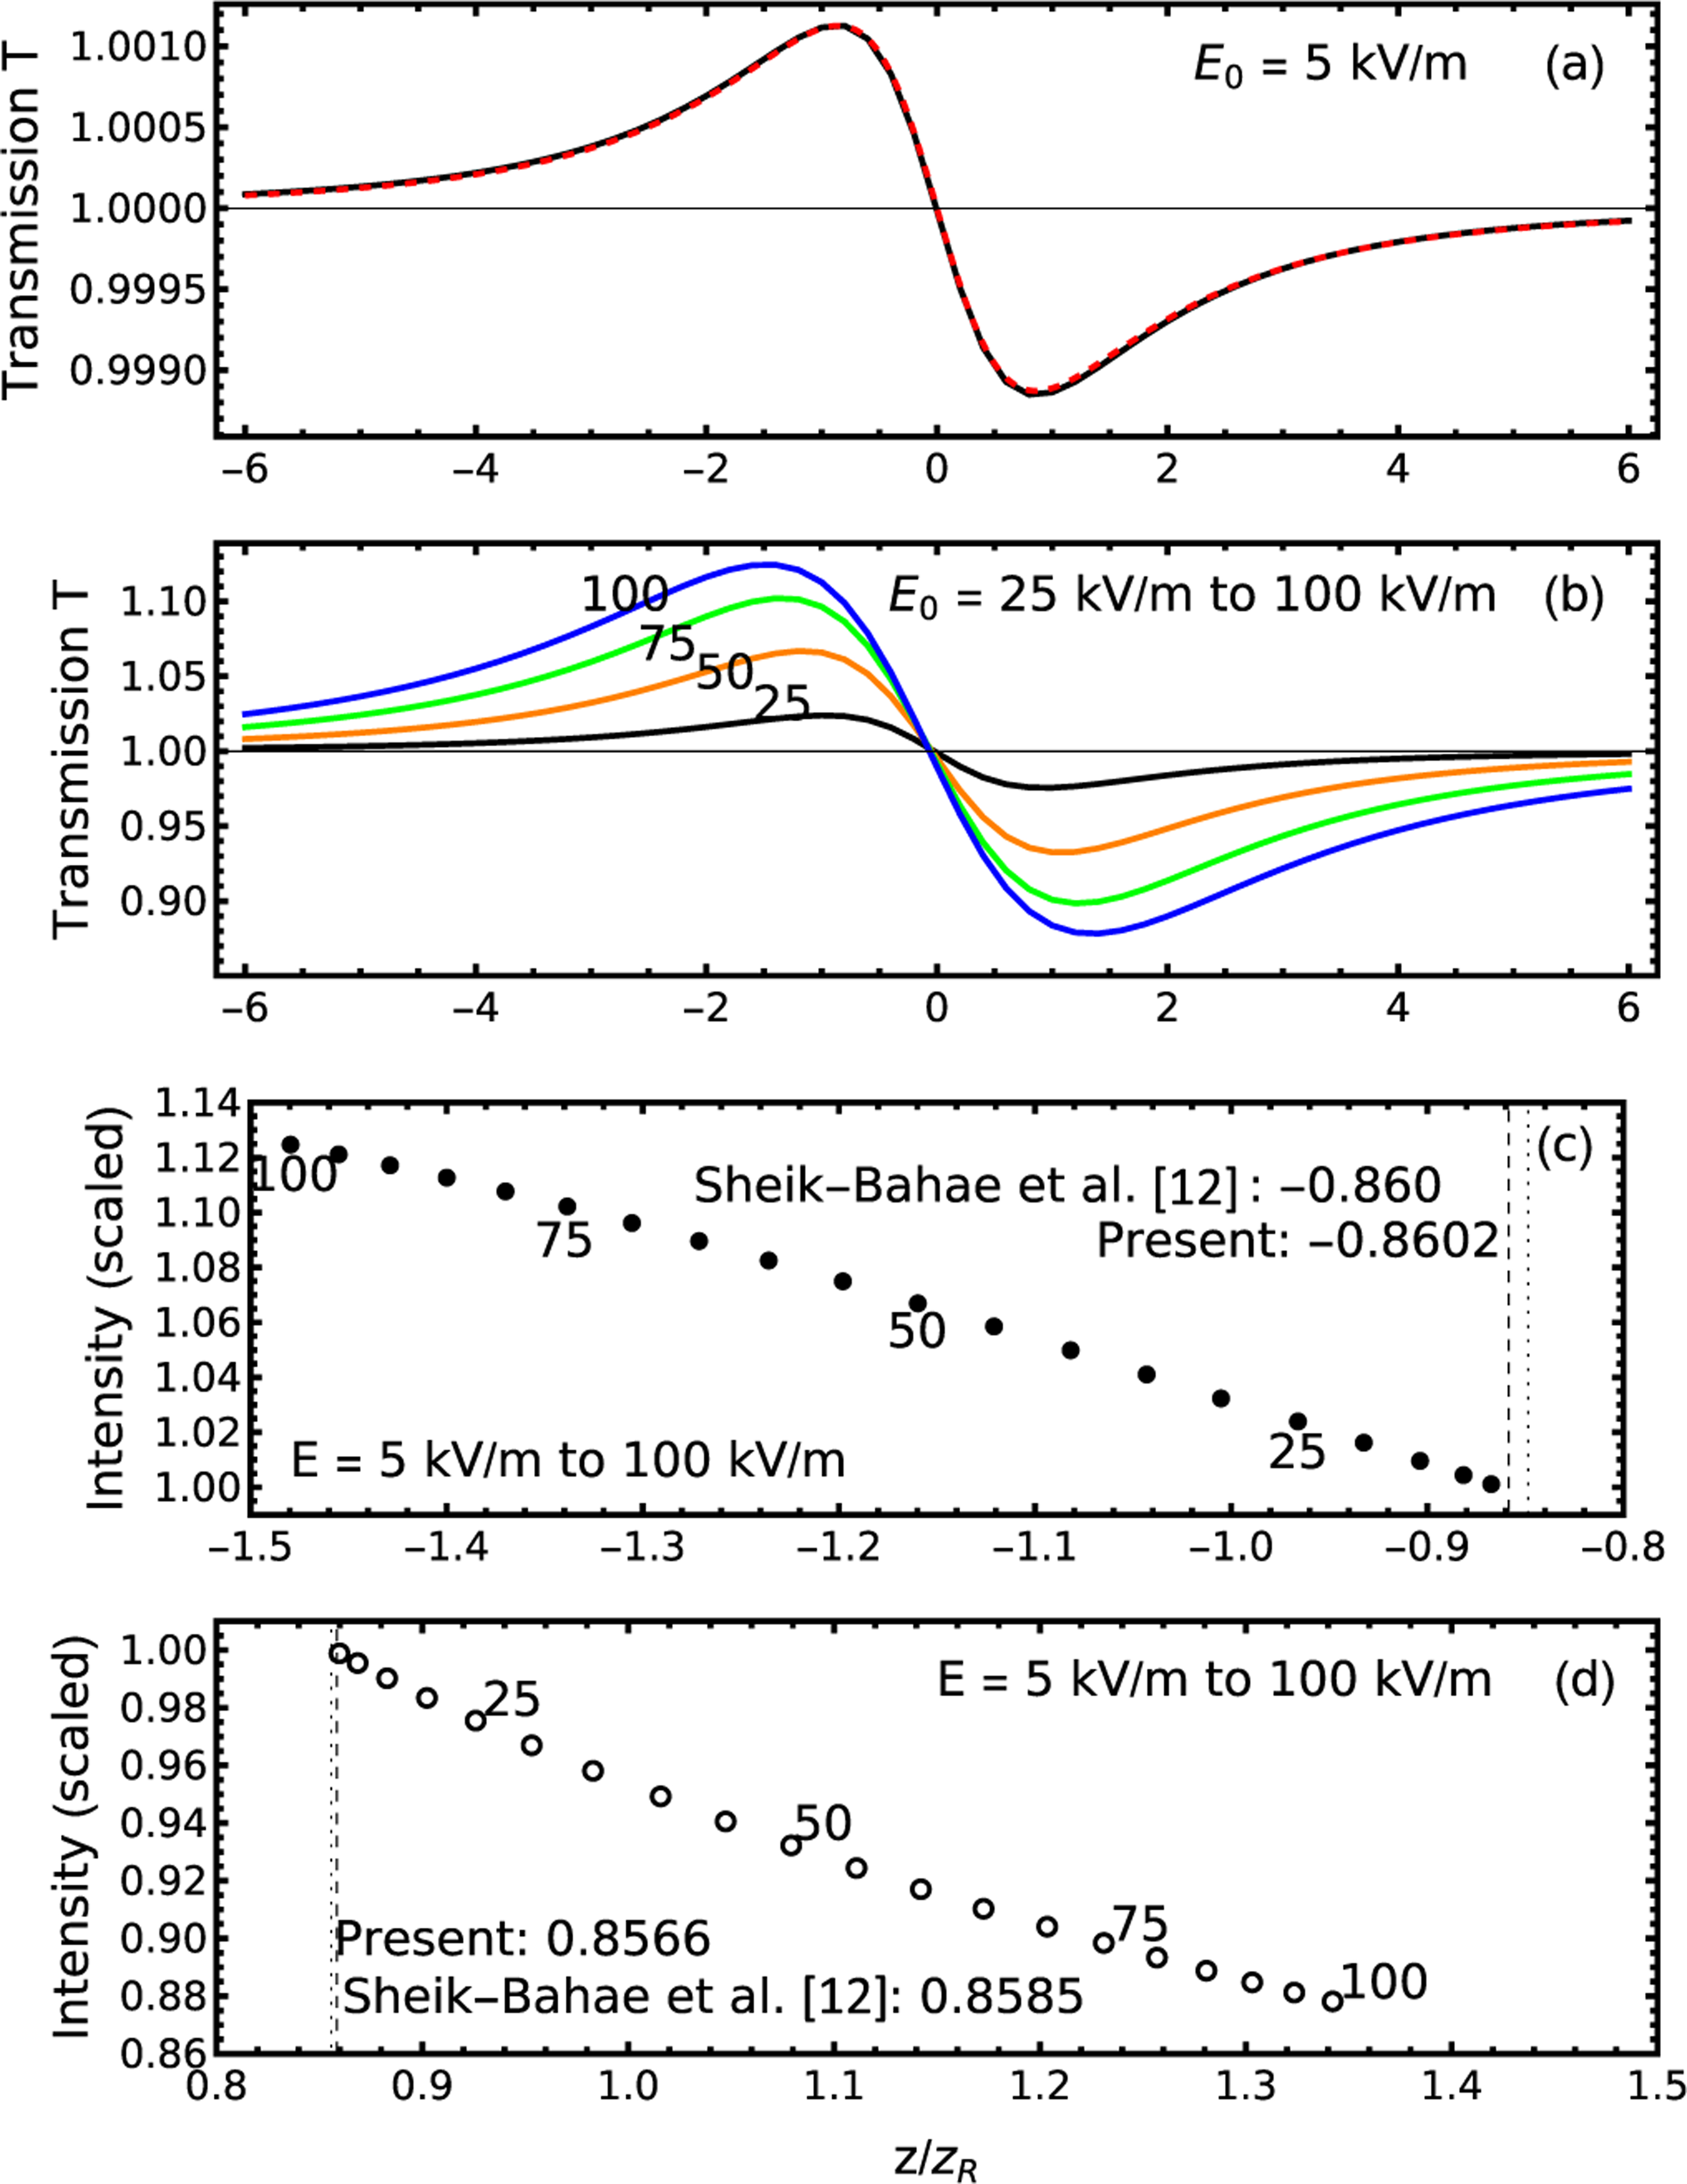
FIG. 3.

(a) For the low electric-field value of 5 kV/m, the scan (black, solid) as calculated with the present method is compared to (red, dashed) the analytic result of the -scan method, Eq. (3); (b) the -scan curves are calculated for higher electric fields, 25–100 kV/m, into the saturated regime; (c) the peak positions and magnitudes from part (b) are plotted along with the analytic and numerically extrapolated limit; (d) similar to (c) for the valley positions and magnitudes.
