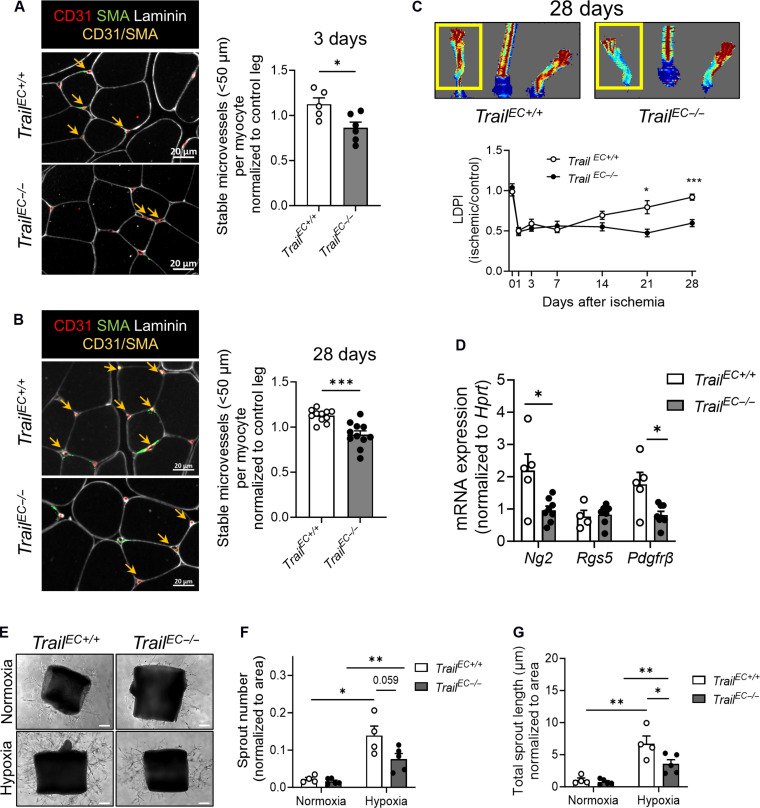
Fig. 4. Stable microvessel numbers are reduced in ischemic limb tissues of TrailEC−/− mice.
(A) Stable microvessels (CD31+SMA+; yellow arrows) in gastrocnemius muscle of TrailEC+/+ and TrailEC−/− mice 3 days after HLI. Left: Representative image of ischemic muscle stained for laminin, CD31, and SMA; scale bars, 20 μm. Right: Quantification (n = 5 to 6 per genotype). (B) Stable microvessels (CD31+SMA+; yellow arrows) in gastrocnemius muscle of TrailEC+/+ and TrailEC−/− 28 days after HLI. Left: Representative image of ischemic muscle stained for laminin, CD31, and SMA; scale bars, 20 μm. Right: Quantification (n = 11 per genotype). (C) Laser Doppler imaging showing blood perfusion over time in TrailEC+/+ and TrailEC−/− mice after HLI. Top: Representative image of blood flow at 28 days. Bottom: Quantification over time (n = 9 to 11 mice per genotype). (D) Pericyte marker mRNA expression in ischemic limbs of TrailEC+/+ and TrailEC−/− mice 3 days after HLI, normalized to hypoxanthine-guanine phosphoribosyl transferase, Hprt (n = 4 to 8 per group). All data from (A) to (D) were normalized to the respective nonischemic control limb. (E) Representative sprouting images. Aortae from TrailEC+/+ and TrailEC−/− mice in response to 8-day hypoxia (2% O2) ex vivo; scale bars, 100 μm. Quantification of (F) sprout number and (G) total sprout length (n = 4 to 5 per genotype). Results are means ± SEM; Mann-Whitney U test or two-way ANOVA; *P < 0.05, **P < 0.01, and ***P < 0.001.

