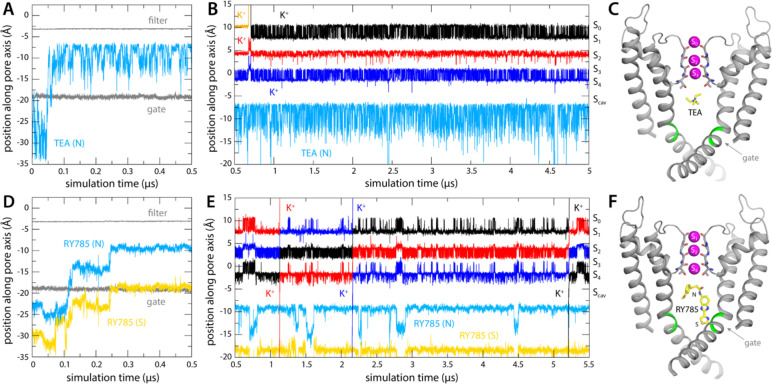
Figure 3. Binding of TEA and RY785 to Kv2.1 channel and impact on K+ permeability.
(A) Time trace of the position of TEA (N atom) in the first 500 ns of the simulation, showing its spontaneous binding to the cavity between the selectivity filter and the cytoplasmic gate (marked by T373 and P406, respectively, whose position is indicated with gray traces). (B) Time trace of the position of TEA for the rest of the 5-μs simulation, alongside those for K+ ions within the selectivity filter, shown as in Figure 2. The location of each of the K+ binding sites therein is indicated alongside the plot. (C) Snapshot of the final snapshot of the simulation, with TEA bound to Scav. Only two of the four channel subunits are shown, for clarity. Residues P406 and I405 are marked in green. (D-F) Same as (A-C), for the simulation of RY785 binding, indicating separately the positions of the central N atom and of the S atom in the distal 5-membered ring.

