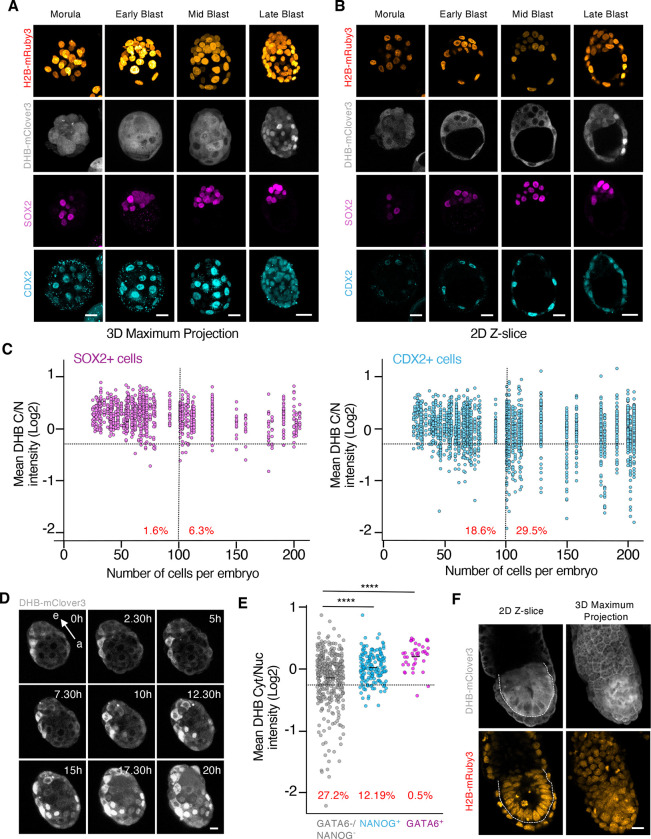
Figure 2. The cells from the TE show a reduction in CDK activity upon implantation.
(A and B) Confocal images from hemizygous ROSA26DHB/H2B embryos during pre-implantation development (from morula to late blastocyst). Scale bar, 20μm.
(C) Plot showing a quantification of C/N mean intensity in individual cells (each represented by a dot) obtained from hemizygous ROSA26DHB/H2B embryos during pre-implantation development. The collection of dots from the same column belongs to embryos with the same cell count. Embryos were staged based on the number of cells and cells classified as SOX2 (left panel) or CDX2 (right panel) expressing cells in each embryo. In red is the percentage of cells below the defined arbitrary threshold (−0.25) shown for embryos containing 0–100 cells (left) and embryos containing above 100 cells (right). N=54 embryos.
(D) Time-lapse microscopy experiment performed in E3.5 isolated hemizygous ROSA26DHB/H2B embryos. One representative embryo is shown. Note how the CDK sensor translocates to the nuclei in TE cells. Arrow indicates the embryonic (e)- abembryonic (a) axis. Scale bar, 15μm.
(E) Plot showing a quantification of C/N mean intensity in individual cells obtained from a pool of hemizygous E4.5 ROSA26DHB/H2B embryos. In red is the percentage of cells below the arbitrary defined threshold (−0.25). p-values are shown from two-tailed unpaired t-tests. **** p<0.0001; N=5 embryos.
(F) Confocal images from E6.5 hemizygous ROSA26DHB/H2B embryos. Dashed line surrounds the EPI. Scale bar, 20μm.

