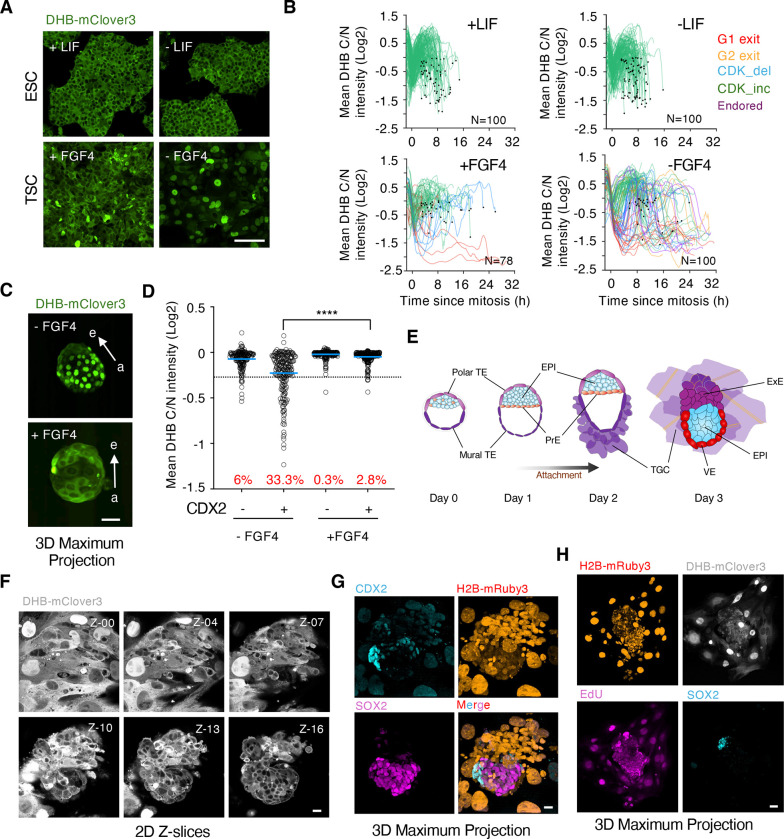
Figure 3. ICM-derived FGF4 establishes a signaling gradient through the embryonic-abembryonic axis.
(A) Confocal images of TSCDHB/H2B and ESCDHB/H2B cells cultured with or without self-renewal signals for seventy-two hours. Scale bar, 100μm.
(B) Single-cell CDK activity traces from TSCDHB/H2B and ESCDHB/H2B cells cultured with or without self-renewal signals for seventy-two hours. All tracks were synchronized in silico to mitosis and the fate of each cell was followed. Criteria to define cells as CDK_inc, CDK_del, Endored, G1 exit and G2 exit are specified in Methods.
(C) Confocal images of representative untreated or FGF4-treated hemizygous ROSA26DHB/H2B embryos cultured for 20 hours after isolation at E3.5. Scale bar, 50μm. Arrows indicate the embryonic (e)- abembryonic (a) axis.
(D) Plot showing quantification of C/N mean intensity in a pool of CDX2+ or CDX2− cells from untreated (N=5 embryos) or FGF4-treated (N=9 embryos). P-value is shown from a two-tailed unpaired t-test. **** p<0.0001. In red is the percentage of cells below the defined sarbitrary threshold (−0.25).
(E) Schematic representation of the embryonic development in vitro of a E3.5 (Day 0 for in vitro culture) blastocyst beyond implantation stages. TE: trophectoderm; EPI: epiblast; PrE: primitive endoderm; TGC: trophoblast giant cell; VE: visceral endoderm; ExE: extraembryonic endoderm. (F) Series of 2D-Z confocal images (3μm slice interval) of a representative hemizygous ROSA26DHB/H2B embryo cultured in vitro three days after isolation at E3.5. Scale bar, 20μm.
(G) Confocal images of the same hemizygous ROSA26DHB/H2B embryo from (F). Scale bar, 20μm. (H) Confocal images of a representative hemizygous ROSA26DHB/H2B embryo cultured three days after isolation at E3.5. Scale bar, 50μm.

