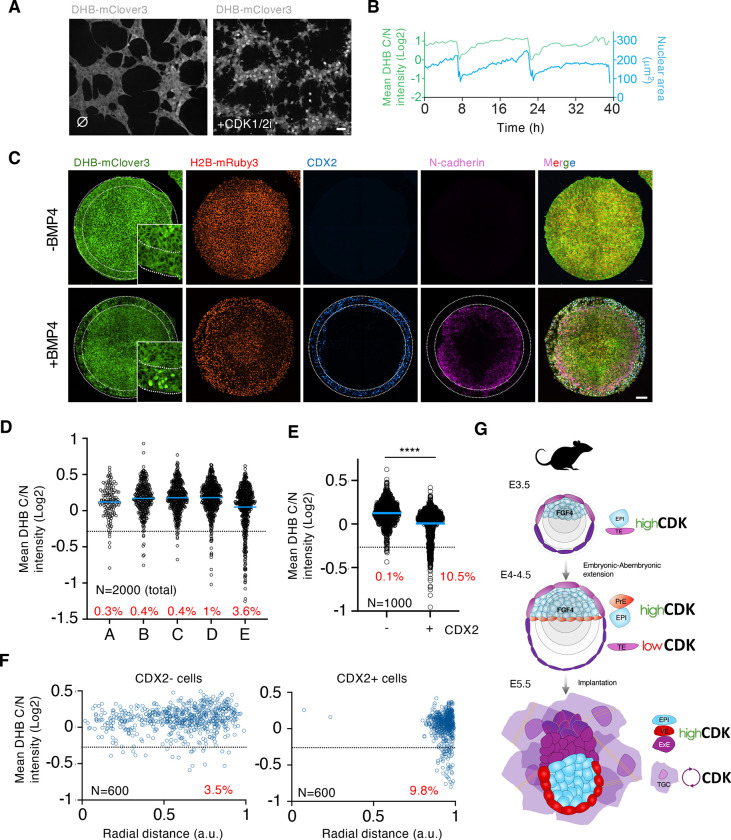
Figure 4. Human TE-like cells show nuclear translocation of the CDK sensor.
(A) Confocal images of human ESCDHB/H2B cultures that were untreated (⌀) or CDK1/2i-treated (30μM) for one hour. Scale bar, 50μm.
(B) Single-cell CDK activity and nuclear trace of a representative proliferating human ESCDHB/H2B. The sudden drop in CDK activity and nuclear size corresponds to a mitotic event.
(C) Confocal images of representative gastruloids uninduced or BMP4-induced for seventy-two hours. Insets can be found for DHB-mClover3 with higher magnification. Dashed lines indicate the outer ring of TE-like cells identified by CDX2 expression. Scale bar, 100μm.
(D) Plot showing a quantification of C/N mean intensity in a total number of 2000 random individual cells distributed according to their position in defined rings from the center of the gastruloid (see Figure S8A for details). In red is the percentage of cells per ring below the defined arbitrary threshold (<−0.25). Data was obtained by combining multiple gastruloids from the same experiment (N=12 gastruloids).
(E) Plot showing a quantification of C/N mean intensity in 1000 random CDX2 positive or negative cells from human gastruloids. p value is shown from a two-tailed unpaired t-test. **** p<0.0001. In red is the percentage of cells below the defined arbitrary threshold (−0.25). Data was obtained by combining multiple gastruloids from the same experiment (N=12 gastruloids).
(F) Plot showing a quantification of C/N mean intensity in 600 random CDX2+ or CDX2− cells distributed according to their radial distance from the center of the gastruloid (see Figure S8A for details). In red is the percentage of cells per ring below the defined arbitrary threshold (<−0.25). Data was obtained by combining multiple gastruloids from the same experiment (N=12 gastruloids).
(G) Schematic model summarizing our findings. TE: trophectoderm; EPI: epiblast; PrE: primitive endoderm; TGC: trophoblast giant cell; VE: visceral endoderm; ExE: extraembryonic endoderm.

