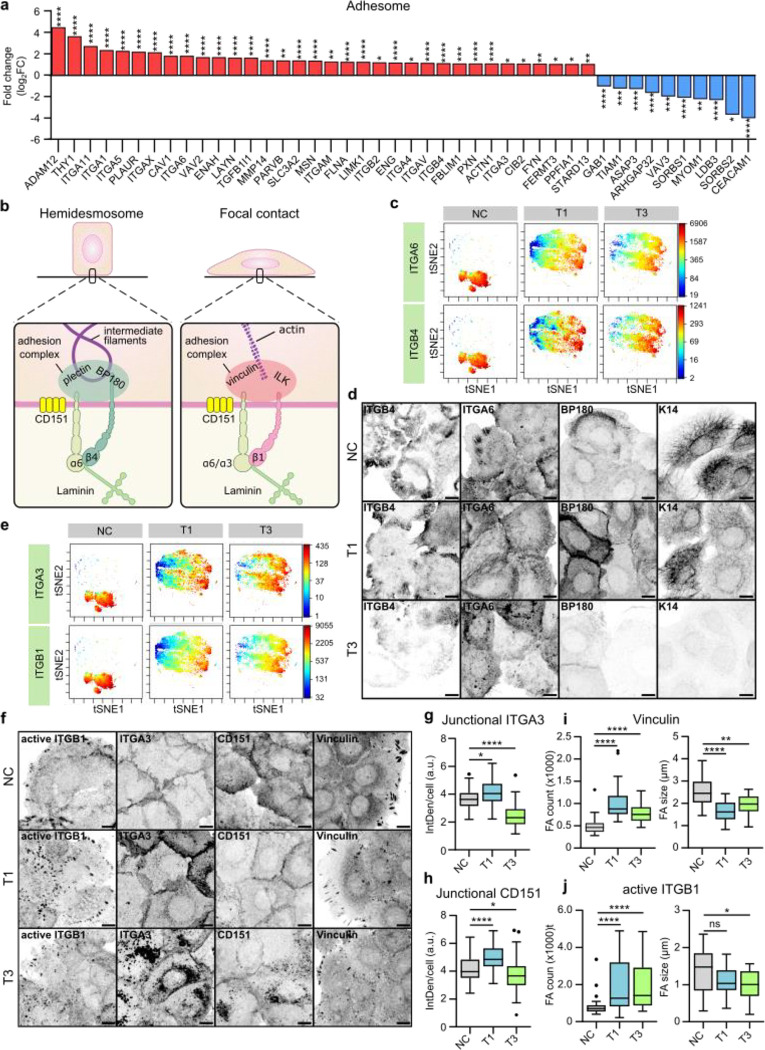
Fig. 2. |. Expression and subcellular localization of laminin-binding integrins is altered in vocal fold cancer.
a, Differentially upregulated and downregulated (fold change, log2) adhesome38,39 genes in VFC (T1-T4, n=54) compared to normal (n=12) patient tissue (TCGA-data, FDR < 0.05). b, Schematic of laminin-binding integrins in hemidesmosomes (α6β4) and focal contacts (α6β1 and α3β1) connecting epithelial cells to the keratin cytoskeleton via BP180 and plectin or actin cytoskeleton via ILK and vinculin. c, t-distributed stochastic neighbor embedding (t-SNE) visualization of ITGA6 and ITGB4 single-cell surface expression (MassCytof) in NC cells and vocal fold T1 and T3 cancer cells. d, Representative ITGA6, ITGB4, BP180 and K14 confocal immunofluorescence images of NC cells and VFC T1 and T3 cells (n=3). Scale bar 10 μm. e, t-SNE visualization of ITGA3 and ITGB1 single-cell surface expression (MassCytof) in NC cells and vocal fold T1 and T3 cancer cells. f, Representative ITGA3, active ligand-engaged ITGB1 (12G10), CD151 and vinculin confocal immunofluorescence images of NC cells and vocal fold T1 and T3 cancer cells (n=3). Scale bar 10 μm. g & h, Quantification of junctional ITGA3 (g) and CD151 (h) in NC (ITGA3 n= 200, CD151 n=209) cells and vocal fold T1 (ITGA3 n=200, CD151 n=199) and T3 (ITGA3 n=199, CD151 n=205) cancer cells. i & j, Quantification of FA number (count) (left) and size (right) using vinculin (i) and active ITGB1 as markers in NC cells (vinculin n=29–30, ITGB1 n= n=28–30), and VFC T1 (vinculin n=30, ITGB1 n=30) and T3 (vinculin n=30, ITGB1 n=29–30) cells. Data are mean box plots or tukey mean-difference plots. n is the total number of cells/ average FA count/size per cell in field of view (FOV) pooled from three independent experiments. FDR was used to asses statistical significance of differentially expressed genes and Kruskal-Wallis test followed by post hoc Dunn’s multiple comparisons test was used to asses statistical significance of junctional and FA proteins.

