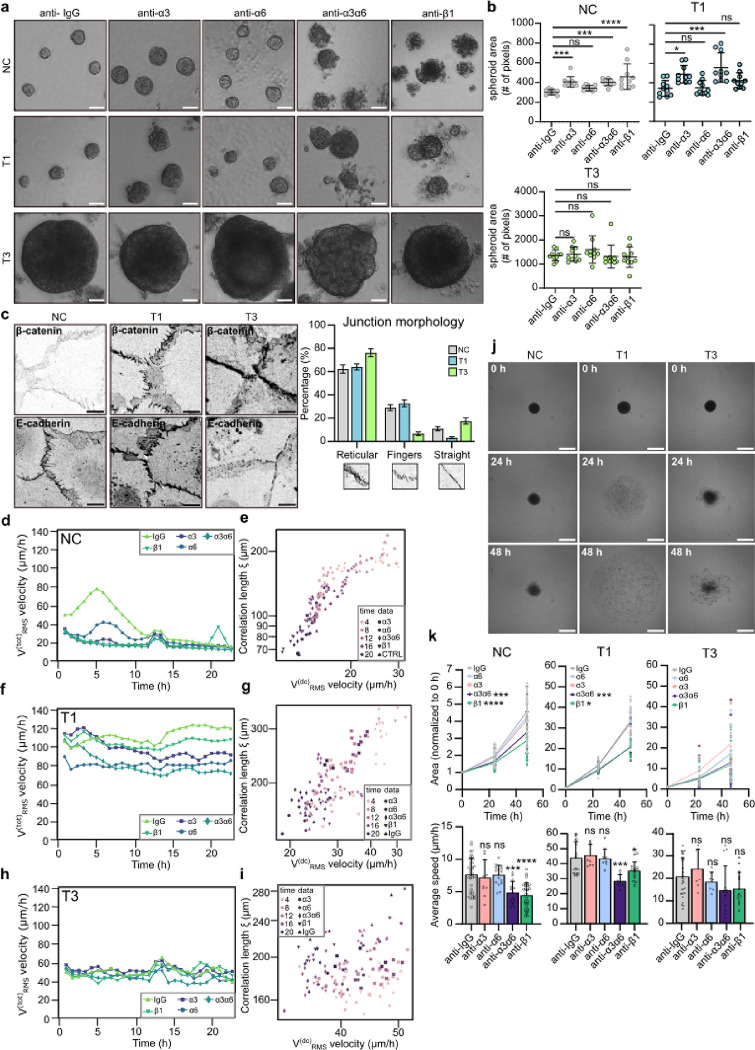
Fig. 4. |. Inhibition of laminin-binding integrins modulates monolayer dynamics and disrupts cell clustering in 3D-spheroids.
a & b, Representative phase contrast images (a) and quantification (b) of spheroid size of NC cells and VFC T1 and T3 cells in 3D Matrigel cultures treated with IgG-control or integrin blocking antibodies (anti-α3, anti-α6, anti-α3α6 and anti-β1) for 11 days (n=3). Scale bar 50 μm. c, Representative β-catenin and E-cadherin confocal immunofluorescence images and quantification of junction morphology of NC and VFC T1 and T3 cells (n=3). Scale bar 10 μm. d-i, Quantification of total RMS velocity (d) and correlation length of NC (d & e) and VFC T1 (f & g) and T3 (h & i) cells treated with IgG-control or integrin blocking antibodies (anti-α3, anti-α6, anti-α3α6 and anti-β1) for 24h. j & k, Representative phase-contrast images (j) and normalized area and average speed (μm/h) (k) of NC and VFC T1 and T3 cells treated with IgG-control or integrin blocking antibodies (anti-α3, anti-α6, anti-α3α6 and anti-β1) undergoing wetting (n=3). Data are mean box plots (± s.d.). Statistical significance was assessed using Kruskal-Wallis test followed by post hoc Dunn’s multiple comparisons test.

