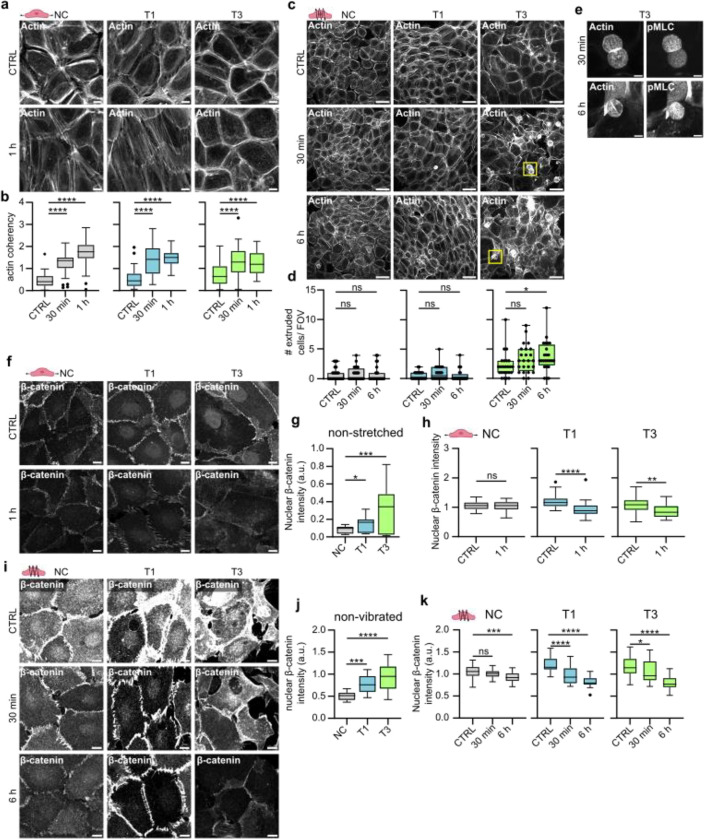
Fig. 5. |. Mechanical stimuli induce cytoskeletal and junctional alterations and cell extrusion in VFC.
a, Representative actin confocal immunofluorescence images of NC cells and VFC T1 and T3 cells subjected to stretching (n=3). Scale bar 10 μm. b, Quantification of actin coherency (alignment) in stretched NC cells and vocal fold T1 and T3 cells (n=3). c & d, Representative actin confocal immunofluorescence images (c) and quantification of extruded (d) NC cells and VFC T1 and T3 cells subjected to vibration (n=3). Scale bar 50 μm. e, Representative actin and pMLC confocal immunofluorescence images of extruded T3 VFC cells subjected to vibration (n=3). Scale bar Scale bar 10 μm. f-h, Representative β-catenin confocal immunofluorescence images (f) and quantification of nuclear expression (integrated density per number of nuclei in FOV) of NC cells and VFC T1 and T3 cells in non-stretched conditions (g) and subjected to stretching (h) (n=3). Scale bar 20 μm. i-k, Representative β-catenin confocal immunofluorescence images (i) and quantification of nuclear expression (integrated density per number of nuclei in FOV) of NC cells and VFC T1 and T3 cells in non-vibrated conditions (j) and subjected to vibration (k) (n=3). Scale bar 20 μm.

