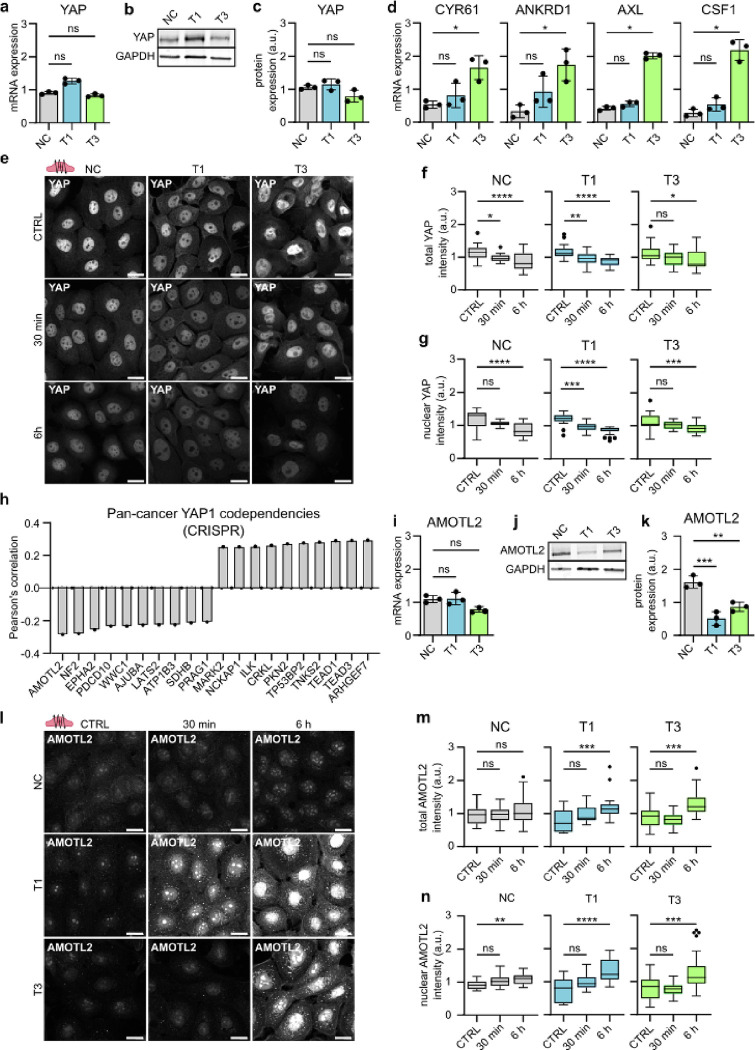
Fig. 6. |. Phonomimetic mechanical stimuli decreases nuclear and total YAP levels.
a, Quantification of relative YAP mRNA expression (gene count) in NC cells and VFC T1 and T3 cells (n=3). b & c, Representative immunoblot (b) and quantification (c) of relative YAP protein expression in NC cells and VFC T1 and T3 cells (n=3). d, Quantification of relative RNA expression of YAP target genes CYR61, ANKRD1, AXL and CSF1 in NC cells and VFC T1 and T3 cells. e, Representative YAP confocal immunofluorescence images of NC cells and VFC T1 and T3 cells subjected to vibration (50–250 Hz, 1 min on/off) for 30 min or 6h compared to non-vibrated control (n=3). Scale bar 20 μm. f, Quantification of total (f) and nuclear (g) YAP intensity (integrated density) in NC cells and VFC T1 and T3 cells subjected to vibration (50–250 Hz, 1 min on/off) for 30 min or 6h compared to non-vibrated control (n=3). h, Quantification of Pan cancer YAP1 CRISPR codependency (DepMap) as Pearson’s correlation. i, Quantification of relative AMOTL2 mRNA expression (gene count) in NC cells and VFC T1 and T3 cells (n=3). j & k, Representative immunoblot (j) and quantification (k) of relative AMOTL2 protein expression in NC cells and VFC T1 and T3 cells (n=3). l, Representative AMOTL2 confocal immunofluorescence images of NC cells and VFC T1 and T3 cells subjected to vibration (50–250 Hz, 1 min on/off) for 30 min or 6h compared to non-vibrated control (n=3). Scale bar 20 μm. m & n, Quantification of total (m) and nuclear (n) AMOTL2 intensity (integrated density) in NC cells and VFC T1 and T3 cells subjected to vibration (50–250 Hz, 1 min on/off) for 30 min or 6h compared to non-vibrated control (n=3). Data are illustrated as tukey box plots or mean box plots ± s.d. (average of 8 FOV’s pooled from three independent experiments). Ordinary one-way Anova followed by post hoc Dunnett’s multiple comparisons test or Kruskal-Wallis test followed by post hoc Dunn’s multiple comparisons test was used to asses statistical significance.

