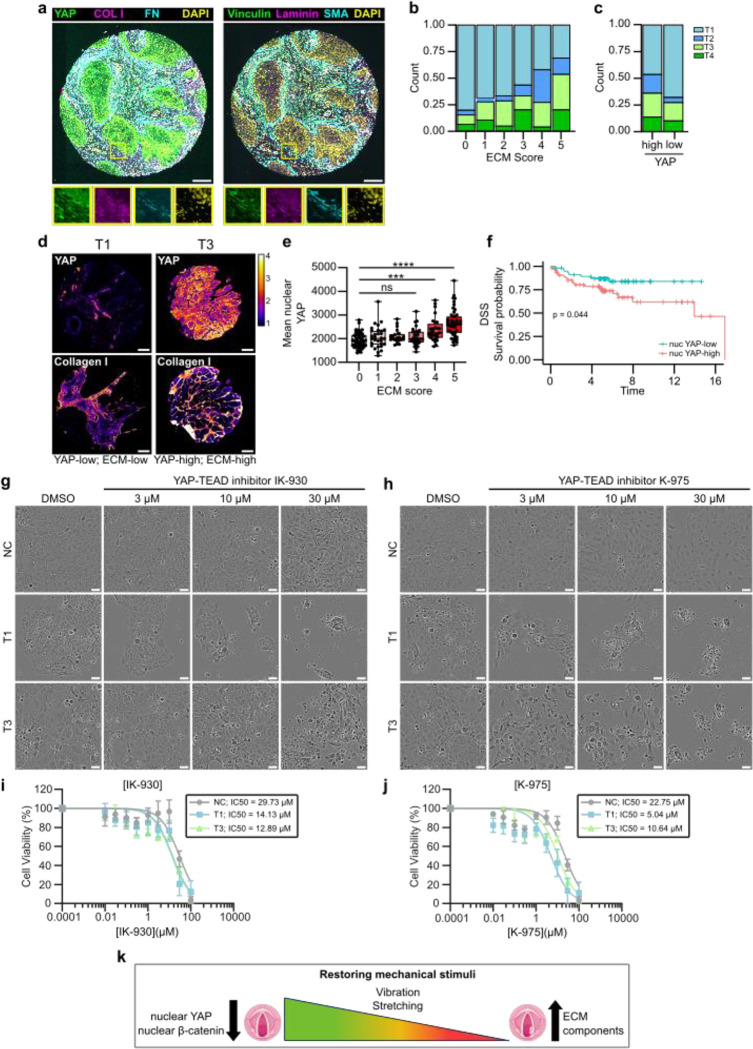
Fig. 7. |. High YAP levels correlate with high ECM expression and poor disease specific survival.
a, Representative composite immunofluorescence images of TMA core stained for YAP/collagen-I/fibronectin/dapi or vinculin/laminin/SMA/dapi. Scale bar 100 μm. b, Quantification of correlation between ECM-score (median patient-level expression of stromal fibronectin, collagen-I, SMA, laminin and vinculin) and T-status in TMA multiplex histology. c, Quantification of correlation between YAP-score (median patient-level expression of epithelial YAP) and T-status in TMA multiplex histology. d, Representative YAP and collagen I staining of T1 and T3 cancer cells in YAP-low & ECM-low sample and YAP-high and ECM-high sample. Scale bar 100 μm. e, Quantification of correlation between ECM-score and mean nuclear YAP expression. f, Disease specific survival of YAP-high and YAP-low patients. g & h, Representative phase contrast images (f) and viability (g) of NC cells and vocal fold T1 and T3 cancer cells treated with YAP-TEAD inhibitor IK-930 for 48h. Scale bar 50 μm. i & j, Representative phase contrast images (i) and viability (j) of NC cells and vocal fold T1 and T3 cancer cells treated with YAP-TEAD inhibitor K-975 for 48h. Scale bar 50 μm. k, Graphical illustration of mechanical intervention of VFC cells as a therapeutic treatment option. Data are mean box plots (± s.d.). Statistical significance was assessed using Kruskal-Wallis test followed by post hoc Dunn’s multiple comparisons test or with Log-rank test for Kaplan-Meier analysis.

