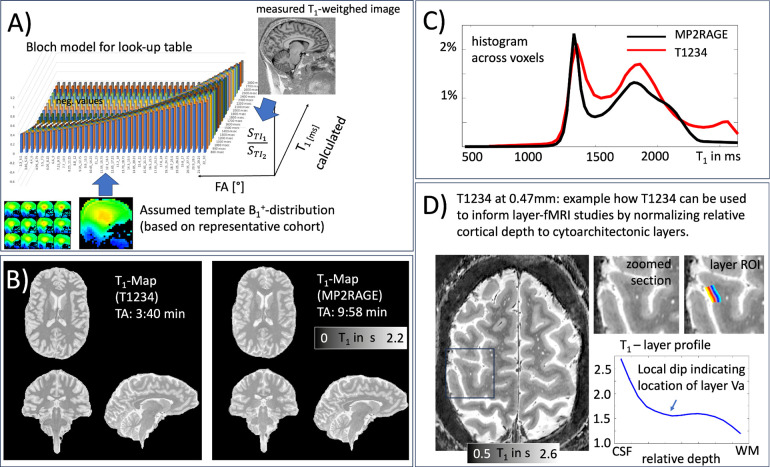
Fig. 3: T1 quantification for the T1234 approach.
A) The Bloch solver (Figure 1B) is used to generate a lookup table of expected relative MR signal intensities for T1 tissue types at both inversion times, depending on TR, FA, and the IR looping structure.
B-C) Representative T1 map and corresponding histogram generated using the proposed approach, compared to a T1 map generated with MP2RAGE. The GM and WM peaks are largely identical.
D) Example application of slab-selective T1234 for layer-fMRI. At higher spatial resolutions for layer-specific mapping, T1234 can be used to identify myeloarchitectonic landmarks to calibrate cortical depth to layers.

