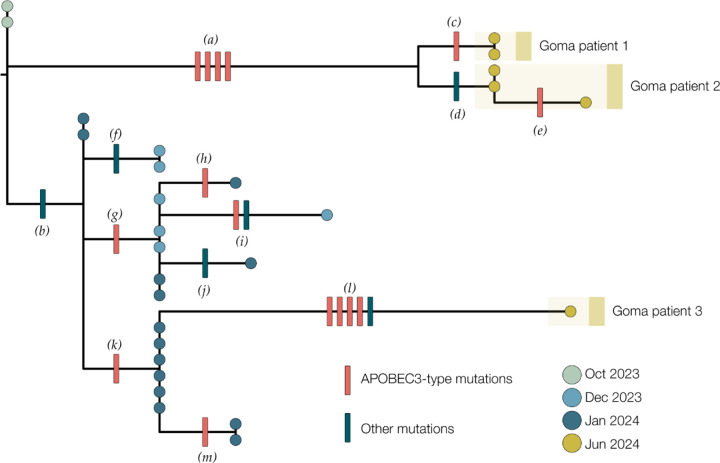
Figure 3:
A maximum likelihood tree constructed using IQ-Tree 2 (22) with the HKY substitution model (26). We included a Clade Ia genome as an outgroup and then removed it after rooting. Single nucleotide mutations are reconstructed and displayed denoting whether they are APOBEC3-mediated (red bars) or other mutations (blue bars). Genomes from recent cases in Goma, North Kivu are denoted with yellow circles. Patients 1 and 2 each have multiple genomes sequenced from different samples. Blue circles are genomes from Kamituga, South Kivu from October and December 2023, and January 2024. Letters in parentheses are referenced in Table 2.

