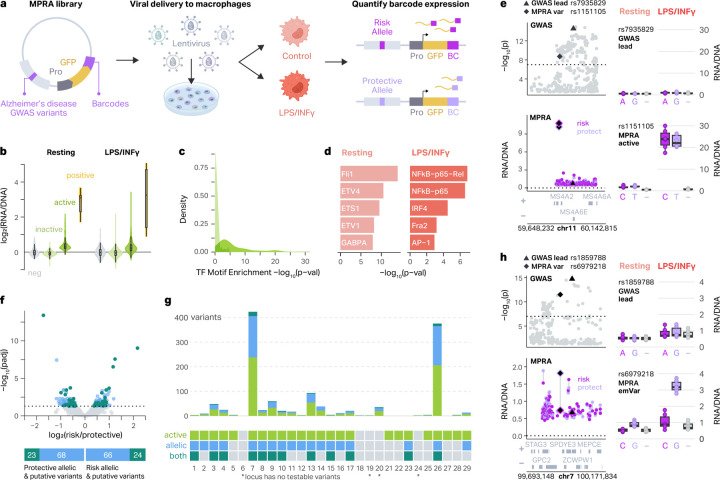
Fig. 1 |. MPRA on AD-associated genetic variants identifies functional regulatory variants.
a, Schematic of the experimental design. The MPRA library includes 3,576 AD-associated variants upstream of a minimal promoter (Pro), GFP reporter gene, and 20 bp barcode. The library was packaged into lentivirus and introduced into THP-1 monocytes, which were differentiated into macrophages. Barcode expression from risk and protective alleles was compared in resting and LPS+INFγ-treated macrophages to define MPRA-active elements and MPRA-allelic variants. b, MPRA activity is shown as log2(RNA/DNA) barcode ratio for negative controls (neg), inactive MPRA elements, active MPRA elements, and positive controls (pos) for resting (left) and LPS+INFγ-treated (right) macrophages. Two-sided Wilcoxon rank-sum tests were conducted in both conditions between the log2(RNA/DNA) ratios for MPRA-active versus MPRA-inactive elements (p < 2.2 × 10⁻¹⁶ resting; p < 2.2 × 10⁻¹⁶ LPS+INFγ). Violin plots represent the overall distribution of the data. Box plots represent the median and 25th to 75th quartile (interquartile range, IQR) and whiskers extend to the most extreme non-outliers. c, Density plot showing the distribution of −log10 p-values of enrichment of TF motifs in MPRA-active and MPRA-inactive elements (Two-sided Wilcoxon rank-sum test, p = 1.0 × 10⁻⁷). d, Top 5 TF motifs enriched in MPRA-active elements in resting (left) and LPS+INFγ-treated (right) macrophages compared to a background set including all inactive elements. e, Example of context-specific MPRA activity at the MS4A6A locus. Manhattan plot showing GWAS −log10 p-values (top left) and MPRA activity for each pair of alleles for each variant (bottom left). GWAS lead variant is represented by a triangle and MPRA-active variant is represented by a diamond. Boxplots showing the activity of each allele for the GWAS lead variant (top right) and MPRA-active variant (bottom right) in both conditions versus negative control (−), where the boxplots show the median and IQR with whiskers extending to the most extreme non-outliers. f, Volcano plot showing allelic-regulatory activity of 3,498 AD-associated variants (top, limma-based mpralm, FDR < 0.05). Bar plots showing which MPRA-allelic variants (green) are also MPRA-active elements (teal), or emVars. g, Barplot showing the number of MPRA-active and/or MPRA-allelic variants at each locus (top). Legend showing which loci have at least one MPRA-active and/or MPRA-allelic variant (bottom). Asterisk represents loci which have no testable variants. h, Example of a context-specific emVar at the ZCWPW1 locus. Manhattan plot showing GWAS p-values (top left) and MPRA activity (bottom left) for each variant. GWAS lead variant is represented by a triangle and MPRA active variant is represented by a diamond. Box plots show the activity of each allele for the GWAS lead variant (top right) and MPRA emVar (bottom right) in both conditions versus negative control (−). The box plots show the median and IQR with whiskers extending to the most extreme non-outliers.

