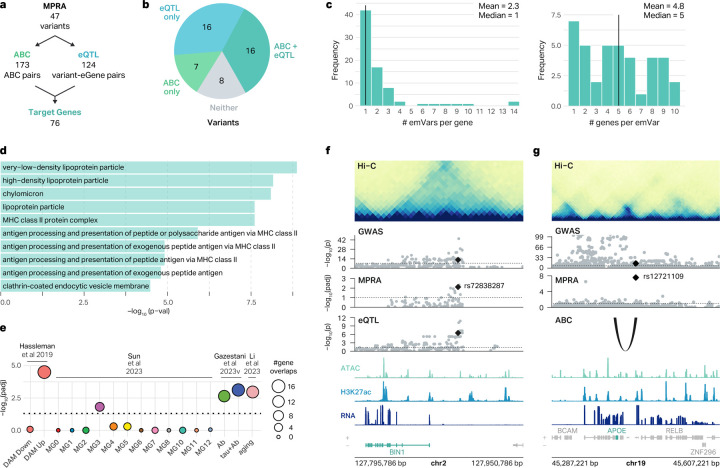
Fig. 4 |. Mapping of emVars to AD risk genes.
a, Workflow showing the number of emVars assigned to target genes by the ABC model and eQTLs. b, Pie chart showing the percentage of emVars that were assigned to a gene by the ABC model and eQTLs. c, Histogram showing the number of emVars connected to each MPRA-AD risk gene (left), and the number of genes connected to each emVar (right). d, GO terms enriched for MPRA-AD risk genes. e, Enrichment of MPRA-AD risk genes with (1) genes upregulated and downregulated in DAMs (Hassleman et al. 2019), (2) AD-associated microglia clusters (Sun et al. 2023), (3) genes differentially expressed in response to Aβ and Tau (Gazestani et al. 2023), and (4) microglial aging-related genes (Li et al. 2023). The size of the circle represents the number of MPRA-AD risk genes overlapping each gene signature. P-values were calculated with two-sided Fisher’s exact test. f, The emVar rs72838287 in the BIN1 locus is connected to BIN1 by microglia eQTLs. ATAC, H3K27ac, and RNA signal tracks have been merged across both conditions. g, The emVar rs12721109 in the APOE locus is connected to APOE by the ABC link in macrophages. ATAC, H3K27ac, and RNA signal tracks have been merged across both conditions.

