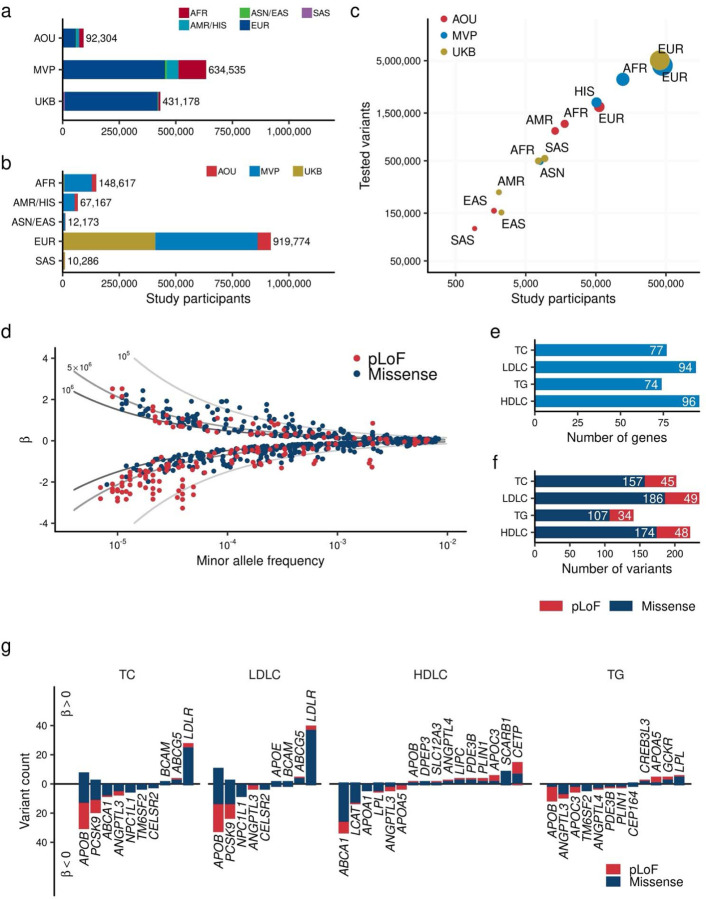
Fig. 1 |. Exome wide association study for blood lipids over one million individuals.
a. and b. Overview of the study. The number of individuals included in the analysis by study (a) and by population (b). c. Correlation between the number of individuals and identified variants in the target region. The horizontal axis shows the number of individuals in each population by study. The vertical axis shows the number of variants identified in the corresponding population. The size of point is proportional to the number of individuals. d. Distribution of effect sizes for exome-wide significant associations is shown. Each dot represents a variant-trait pair with significant association in this study (Methods). All four blood lipids are plotted. The horizontal axis indicates the minor allele frequency, while the vertical axis displays the effect size for each allele from the regression model (β), with the unit of effect size normalized to the standard deviations of blood lipids. The lines represent the statistical power of 80% at sample sizes of one million (dark gray), 500,000 (medium gray), and 100,000 (light gray) individuals. c. Minor allele frequency of associated variants by variant impact. The rectangles illustrate the interquartile range of the minor allele frequencies, with the bottom and top edges representing the first and third quartiles, respectively. The line inside the rectangle denotes the median and the whiskers extend from the quartiles to the smallest and largest observed values, within a distance no greater than 1.5 times the interquartile range. d. Direction of the effects for associated variants. Variants positively associated with the blood lipids are displayed on the positive side of the vertical axis. The height of each bar represents the number of variants in that category. Bar colors indicate variant classes, with blue for missense variants and red for pLoF variants. AFR, African-like population; AMR, Admixed-American-like population; ASN, Asian-like population; EAS, East-Asian-like population; EUR, European-like population; HIS, Hispanic-like population; SAS, South-Asian-like population; TC, Total Cholesterol; LDLC, Low Density Lipoprotein Cholesterol; HDLC, High Density Lipoprotein Cholesterol; TG, Triglycerides; pLoF, predicted Loss of Function; EWS, Exome Wide Significance.

