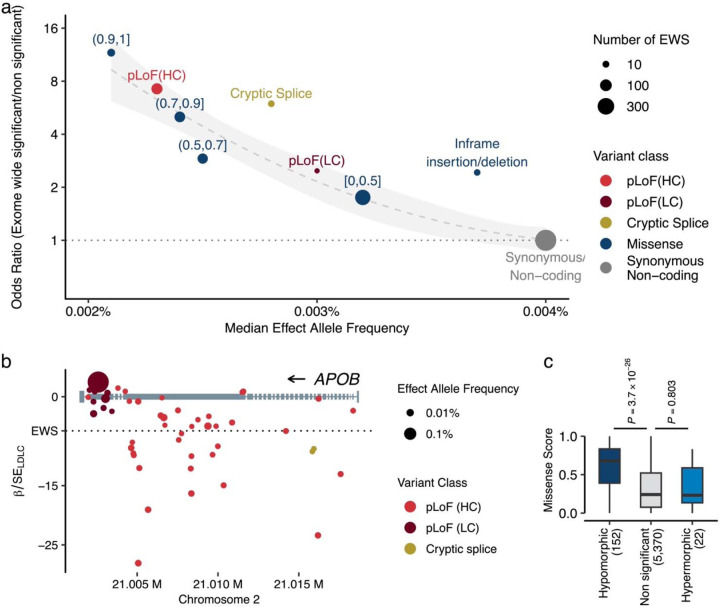
Fig. 2 |. Different expressivity of rare coding variants by variant classes.
a. Variant deleteriousness, constraints, and statistical associations. The panel represents variant classes as pLoF (red), Missense (blue), and Synonymous/Non-coding (gray, used as reference). The ranges associated with the blue points depict the Missense Score for missense variants. We computed the Missense Score for missense single nucleotide variants by using 29 in-silico deleteriousness prediction algorithms. The score was calculated as the number of deleterious predictions divided by the number of available algorithms for each variant, with values ranging from 0 to 1 (Methods). Based on the Missense Scores, missense variants were grouped into bins. pLoF variants were grouped by LOFTEE predictions. The horizontal axis indicates the median minor allele frequency for each variant class, while the vertical axis shows the odds ratios of EWS to non-EWS variants in reference to Synonymous/Non-coding variants. Odds ratios were estimated by Fisher’s Exact test. Circle size corresponds to the number of variants achieving EWS in each variant class. The dashed curve is the estimated line, and the shaded area is its 95% confidence interval. b. Penetrance of pLoF variants in the APOB. Gray rectangles represent the APOB gene model. Circles correspond to genetic variants examined in this study, with circle size denoting effect allele frequency, and color signifying variant class. The horizontal axis outlines genomic coordinates (hg38), whereas the vertical axis indicates Z-values (Beta/Standard Error) for LDLC association calculated by liner mixed model (Methods). c. Different distributions of Missense Scores (See above) observed in hypermorphic and hypomorphic variants. The box plot displays the distribution of Missense Scores for Missense variants within genes that have at least one EWS association by pLoF. A hypomorphic variant is defined as having the same directional association with EWS pLoF association. The P-values were calculated by two-sided Wilcoxon’s rank-sum test. The P-values were not adjusted for multiple testing correction. Conversely, a hypermorphic variant is defined as having an opposite directional association to EWS. pLoF, predicted Loss of Function; HC, High Confidence; LC, Low Confidence; EWS, Exome Wide Significance; LDLC, Low Density Lipoprotein Cholesterol.

