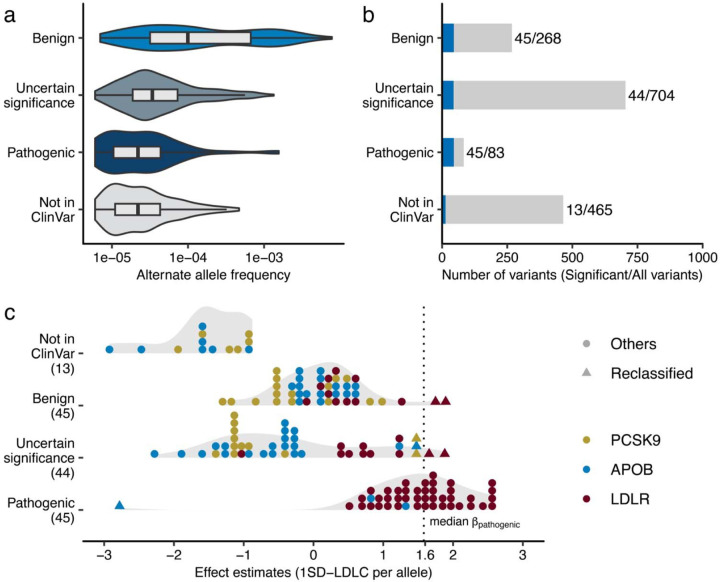
Fig. 5 |. Re-evaluation of clinically curated pathogenic variants for FH.
a. Variant allele frequencies of FH-related ClinVar variants observed in the study. The rectangles illustrate the interquartile range of the minor allele frequencies, with the bottom and top edges representing the first and third quartiles, respectively. The line inside the rectangle denotes the median and the whiskers extend from the quartiles to the smallest and largest observed values, within a distance no greater than 1.5 times the interquartile range. b. Phenotype associations of FH-related ClinVar variants. The height of the bar indicates total number of variants in the category, and the blue color indicates the proportion of the variants significantly associated with clinical LDLC levels in this study. Statistical significance determined using Bonferroni adjustment. c. Distribution of the effect sizes for ClinVar FH associated variants determined in this study. Each dot represents a variant in PCSK9, APOB, or LDLR. The color of each dot indicates the associated gene. The dashed, vertical line indicates median effect size for established pathogenic variants. Triangles indicate variants of uncertain significance with large effect sizes, as well as pathogenic variants with a negative effect size on clinical LDLC levels. SD, Standard Deviation; LDLC, Low Density Lipoprotein Cholesterol. FH, Familial Hypercholesterolemia.

