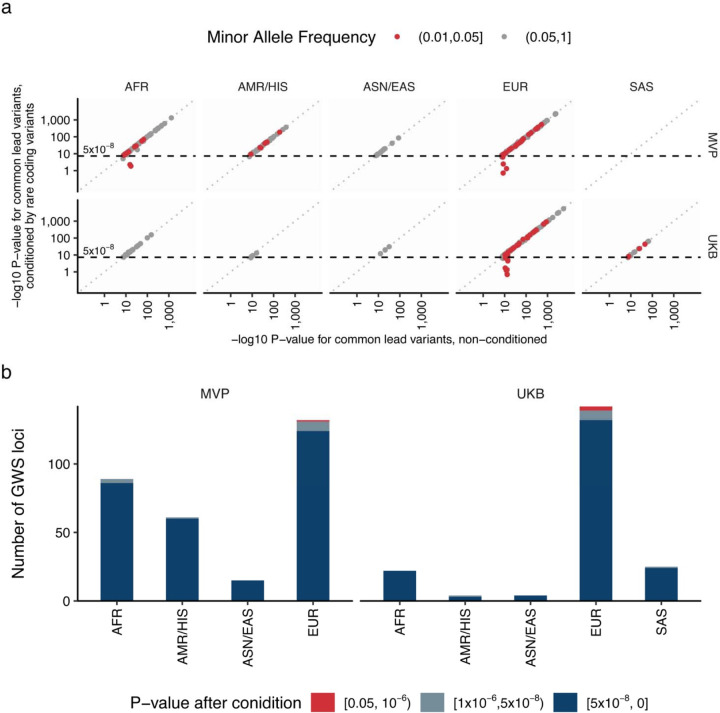
Extended Data Figure 6 |. Independence of common genetic signals and rare genetic signals.
a. Each dot indicates common genetic variant (MAF ≥ 1%) associated with blood lipids within the loci identified by rare genetic associations in this study. We compare non-conditioned and conditioned statistics in this figure to assess the independence of common genetic signals and rare genetic signals. In conditioned analysis, we introduced all the associated rare variant genotypes as covariates in the linear regression model (Methods and Supplementary Notes V). The horizontal axes show -log10 P-values without conditioning and the vertical axes show them with conditioning by rare variant genotypes with EWS. The P-values were calculated by linear regression model with two-sided test. The P-values were not adjusted for multiple testing correction. b. The number of common genetic signals affected by rare genetic signals were summarized in the bar chart. The bar chart indicates number of common genetic signals, and the color classifies the signals based on the P-values of common genetic signals after conditioning by rare genetic signals. MVP, Million Veteran Program; UKB, UK Biobank; AFR, African-like population; AMR, Admixed-American-like population; ASN, Asian-like population; EAS, East-Asian-like population; EUR, European-like population; HIS, Hispanic-like population; SAS, South-Asian-like population; TC, Total Cholesterol; LDLC, Low Density Lipoprotein Cholesterol; HDLC, High Density Lipoprotein Cholesterol; TG, Triglycerides.

