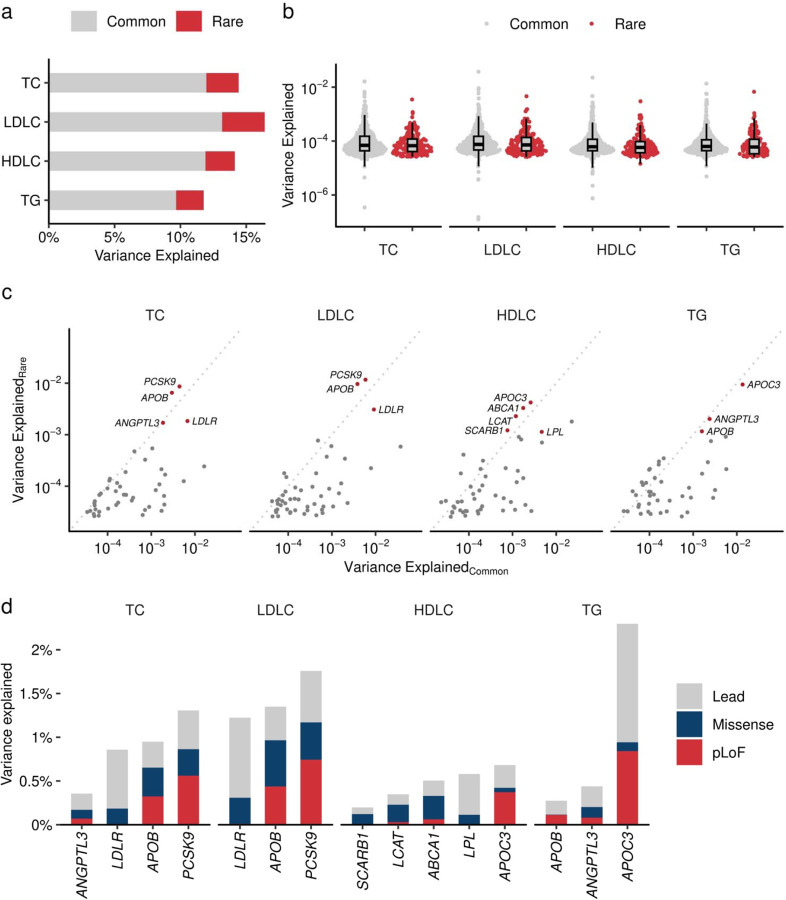
Extended Data Figure 9 |. Contribution of rare coding variants to trait variance.
a. Phenotypic variance explained (PVE) by common and rare variants. The height of the bar chart indicates the PVE by GWAS lead variant (yellow) and the sum of rare coding variants in the locus (dark blue). PVE is computed by the formula 2f(1-f)β2, where f is the allele frequency and β is the effect size. b. PVE by individual variants. Grey dots indicate common (Grahan et al. Nature 2021) and red dots indicate rare (current study) variants. Boxplot shows the median value as the centerline; box boundaries show the first and third quartiles and whiskers extending 1.5 times the interquartile range. c. Trait variance by rare coding variant and common genetic signals. The horizontal axis indicates PVE by lead variant in the GWAS loci. The vertical axis indicates the sum of PVEs by rare coding variants in the locus. d. The cumulative contribution of lead and rare coding variants for trait variance. PVE by each rare variant in representative genes. Lead variant in the locus in gray, the sum of PVEs by pLoF in red and missense in dark blue. PVE, Phenotypic Variance Explained; GWAS, Genome Wide Association Study. TC, Total Cholesterol; High Density Lipoprotein Cholesterol; LDLC, Low Density Lipoprotein Cholesterol; TG, Triglycerides; pLoF, predicted Loss of Function.

